Polar Graphing Sorting Activity

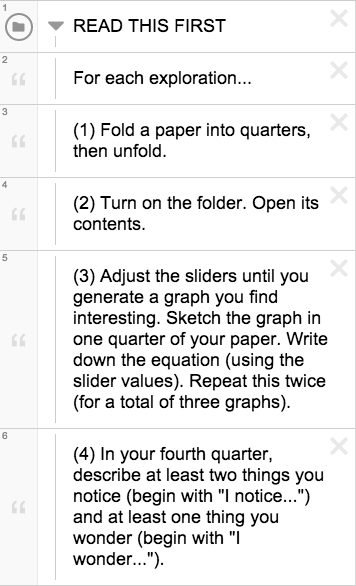
After an introduction and exploration (which I wrote about here and here) to my polar graphing unit, I wanted to steer our attention in a more algebraic direction so we could establish some connections between polar and Cartesian forms.

On top of that, I needed an activity that would work well with a sub. The intersection of those wants and needs? A sorting activity!

Polar Graphing Sorting Activity 16A Polar Graphing Sorting Activity 16B


Print ’em out, slice ’em up, throw ’em in a Ziploc and we’re ready for action.

Students worked in small groups on the following:

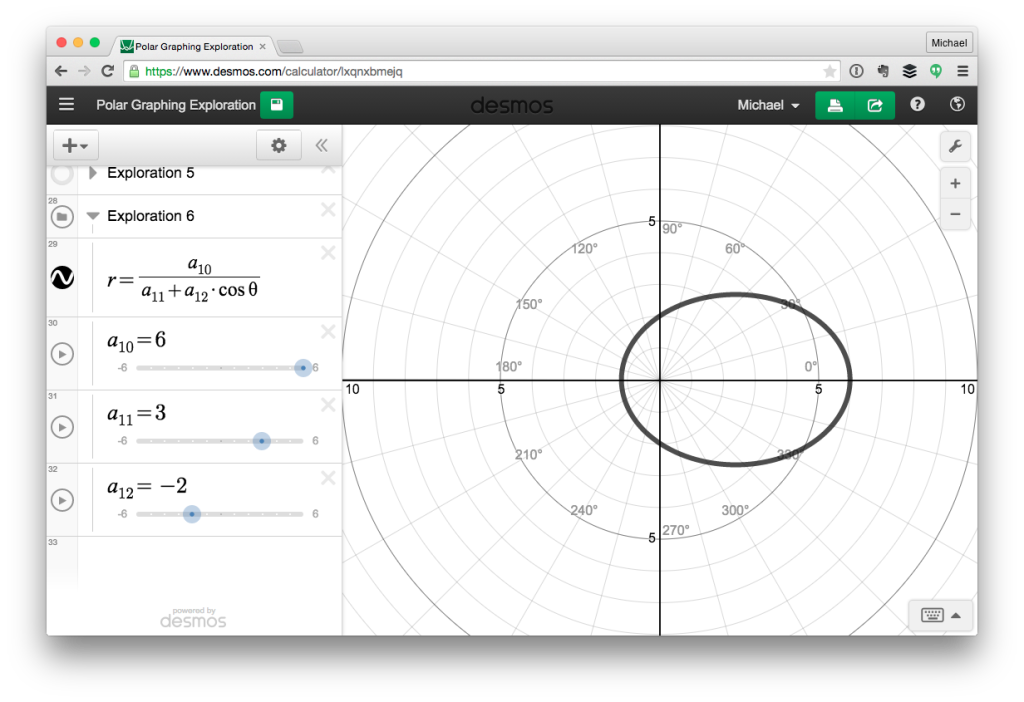
  1. Plot the polar equations in Desmos.
  2. Plot the Cartesian equations in Desmos.
  3. Match each graph with its polar and Cartesian equations.
  4. Match each graph description with its cards (polar equation/Cartesian equation/graph).

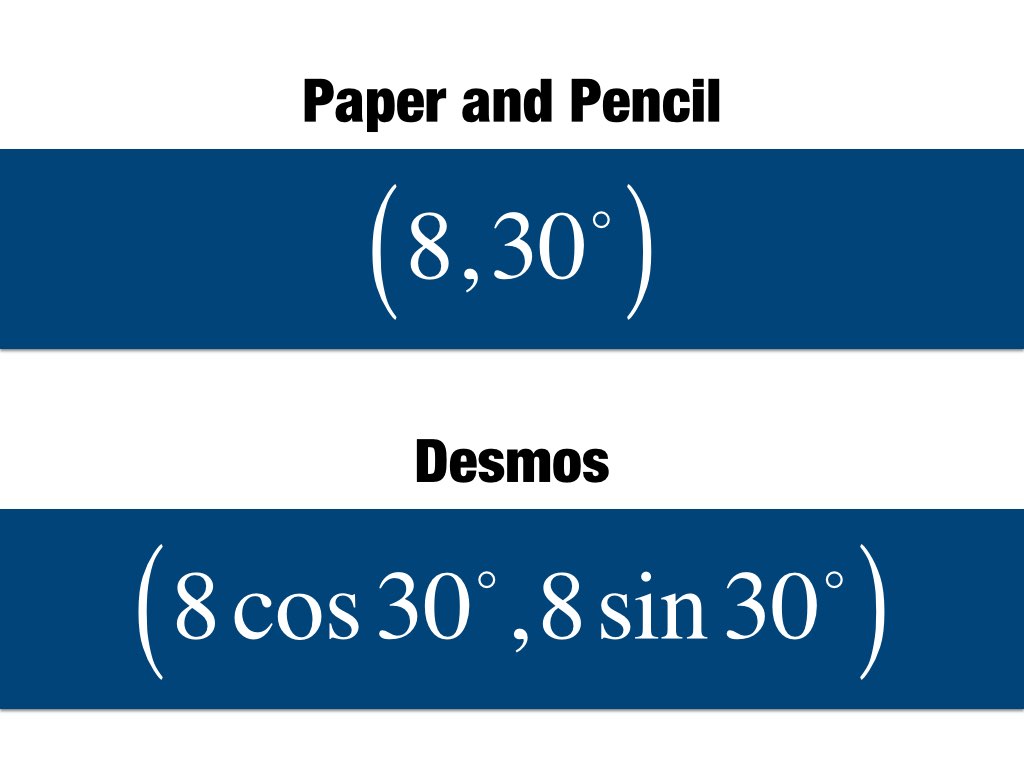
I challenged students to be on the lookout for connections between the two equation forms. This is something we’ll develop further in an upcoming lesson.

But Wait, There’s More!

Sorting activities are great because they often prompt lots of discussion within the groups. However, they’re sometimes short and sweet. With that in mind, I prepared another sub-proof task for my students: A pair of equation-converting examples, followed by several practice problems. If you’re curious to see the handout, which is seriously limited in focus/scope) click here.

Looking for the sorting activity slide deck instead?

What Can You Do, Now?

The other day in Math B (mostly 8th graders) we spent a decent chunk of class time working on something rather boring. But somewhere in that boringness, something awesome happened.

I had prepared two related, but non-identical handouts, each with ten problems related to CCSS.8.F.04. Prior to class, I decided I would use the first handout as source material for a few examples and the second handout as our pool of practice problems.

After the first example, I paused. Instead of moving immediately on to a second example, I told my students:

“Alright, kiddos. Look through the second handout and put a mark next to every problem you think you’re now equipped to tackle.”

No big deal, right? Well, I’m starting to think it might be. This simple request produced a not-so-subtle shift in their approach, one that I think may have had an important impact on their mindset.

Instead of moving through a full set of examples, and then turning our attention to a full set of practice problems, where comments like “I’m confused,” “I’m stuck,” “I don’t know how to do this,” and (especially) “You never showed us one like this!” might abound, my students were actively hunting for problems within their reach. And if my informal observations are on track, then in the context of that active hunting, my students extended their reach a bit farther than normal.

Is this a one-time fluke? Or is asking students to search for what they can do a subtle way of boosting what they’re capable of?

Call for Comments

If you have any thoughts on what I’ve described above, whether anecdotes from your own class or links to research, drop a line in the comments!

Polar Graphing Exploration

Over the weekend I wrote about an alternative launch to my Precalculus polar graphing unit. After that first lesson, I decided to throw out my usual “Day 2 Notes” and replaced them with a six-part, Desmos-driven exploration.

I started by having students fire up Desmos, working in a 2:1 arrangement (two students per screen). While they got that ready to go, I distributed a stack of printer paper to each table. I’ll cut right to the chase here, since the directions are included in the graph:

polar-graphing-exploration-directions

I find that adding a folder called “Directions” is like waving a big red flag and shouting, “Do NOT read this!” My favorite direct approach is, “Read this first.”

(My favorite reverse-psychology tactic is to put the directions inside a folder at the top titled “Top Secret!” The “success” rate for students opening up such a folder is pretty fantastic. Or depressing. I suppose it depends on your perspective.)

At any rate, here are a few screens from the exploration:

polar-graphing-exploration-1

polar-graphing-exploration-2 polar-graphing-exploration-3 polar-graphing-exploration-4 polar-graphing-exploration-5

polar-graphing-exploration-6

Interested in tinkering a bit on your own? You can access the exploration sandbox here:

bit.ly/polar-5

Post Script

Why the 5 in bit.ly/polar-5, you ask? Because it took me five tries to get it right. 🙂

You Might Also Enjoy…

Here’s something I stumbled across on the Twitter after creating the exploration described above. (Thanks to Desmos for the tap on the shoulder.) Lots to love in David’s approach. Check it out for yourself:

Polar Graphing Introduction

My polar graphing unit in Precalculus has always started in the same lackluster way: With me telling students how to graph polar coordinates. We then launch into some point-by-point graphing, followed by various explorations and challenges involving graphing polar equations, and we’re off to the races.

This year I wanted to try something different. Instead of telling students how to plot polar coordinates, I wanted them to discover the mechanics by using technology to plot a handful of points.

It wasn’t exactly profound, but this brief introductory lesson felt like an improvement. I started by displaying these images:

Polar Graphing Introduction.001

Polar Graphing Introduction.002

Polar Graphing Introduction.003

We then fired up Desmos, with students working in pairs. Once everyone successfully plotted the first point, I turned them loose on this:

Polar Graphing Assessment

That’s my “can you plot points in the polar coordinate plane” assessment from last year. I don’t allow students to use a calculator on it, at least not when it’s a real assessment. As a learning tool, especially without the usual direct instruction intro, this page paired nicely with a bit of technology.

Debriefing

My favorite part from this brief lesson came at the end when we discussed what to do with negative radii and/or negative angles. In the past, it was a lot of “do this” and “do that” and “don’t forget this.” Here, I invited students to share their observations and make conjectures about points involving negative values.

And the payoff was in what happened next: Instead of “yes, that’s right” or “nope, try again” from me as the expert, we turned back to Desmos to test (and in most cases refine) our conjectures. While there’s still some learning to be done here, I think we’re got off to a decent start.

Looking Ahead

Next up, in reality: A Desmos-driven, noticing-and-wondering exploration with six types of polar equations. If all goes according to plan, I’ll blog about it soon.

Next up, in my ideal world: In the future, I’d prefer to squeeze an extra lesson in prior to the aforementioned/upcoming exploration. This in-between lesson would involve each student receiving an equation, finding its value every 10 degrees (from 0 to 360), and plotting those points by hand on a polar grid. I think this would serve as a nice link between the “hey, now I can graph polar points!” lesson described above, and the “oh, sweet! Desmos can graph these equations in milliseconds” exploration that follows. Maybe next time…