Deprecated: Function get_magic_quotes_gpc() is deprecated in /home3/reasonan/public_html/wp-includes/formatting.php on line 4371
Deprecated: Function get_magic_quotes_gpc() is deprecated in /home3/reasonan/public_html/wp-includes/formatting.php on line 4371
Warning: count(): Parameter must be an array or an object that implements Countable in /home3/reasonan/public_html/wp-includes/media.php on line 1206
Deprecated: Function get_magic_quotes_gpc() is deprecated in /home3/reasonan/public_html/wp-includes/formatting.php on line 4371
Deprecated: Function get_magic_quotes_gpc() is deprecated in /home3/reasonan/public_html/wp-includes/formatting.php on line 4371
Warning: count(): Parameter must be an array or an object that implements Countable in /home3/reasonan/public_html/wp-includes/media.php on line 1206
Deprecated: Function get_magic_quotes_gpc() is deprecated in /home3/reasonan/public_html/wp-includes/formatting.php on line 2432
Deprecated: Function get_magic_quotes_gpc() is deprecated in /home3/reasonan/public_html/wp-includes/formatting.php on line 4371
Deprecated: Function get_magic_quotes_gpc() is deprecated in /home3/reasonan/public_html/wp-includes/formatting.php on line 4371
Deprecated: Function get_magic_quotes_gpc() is deprecated in /home3/reasonan/public_html/wp-includes/formatting.php on line 4371
Deprecated: Function get_magic_quotes_gpc() is deprecated in /home3/reasonan/public_html/wp-includes/formatting.php on line 4371
Deprecated: Function get_magic_quotes_gpc() is deprecated in /home3/reasonan/public_html/wp-includes/formatting.php on line 4371
Deprecated: Function get_magic_quotes_gpc() is deprecated in /home3/reasonan/public_html/wp-includes/formatting.php on line 4371
Deprecated: Function get_magic_quotes_gpc() is deprecated in /home3/reasonan/public_html/wp-includes/formatting.php on line 4371
Deprecated: Function get_magic_quotes_gpc() is deprecated in /home3/reasonan/public_html/wp-includes/formatting.php on line 4371
Deprecated: Function get_magic_quotes_gpc() is deprecated in /home3/reasonan/public_html/wp-includes/formatting.php on line 4371
Deprecated: Function get_magic_quotes_gpc() is deprecated in /home3/reasonan/public_html/wp-includes/formatting.php on line 4371
Deprecated: Function get_magic_quotes_gpc() is deprecated in /home3/reasonan/public_html/wp-includes/formatting.php on line 4371
Deprecated: Function get_magic_quotes_gpc() is deprecated in /home3/reasonan/public_html/wp-includes/formatting.php on line 4371
Deprecated: Function get_magic_quotes_gpc() is deprecated in /home3/reasonan/public_html/wp-includes/formatting.php on line 4371
Deprecated: Function get_magic_quotes_gpc() is deprecated in /home3/reasonan/public_html/wp-includes/formatting.php on line 4371
Deprecated: Function get_magic_quotes_gpc() is deprecated in /home3/reasonan/public_html/wp-includes/formatting.php on line 4371
Deprecated: Function get_magic_quotes_gpc() is deprecated in /home3/reasonan/public_html/wp-includes/formatting.php on line 4371
Deprecated: Function get_magic_quotes_gpc() is deprecated in /home3/reasonan/public_html/wp-includes/formatting.php on line 4371
Deprecated: Function get_magic_quotes_gpc() is deprecated in /home3/reasonan/public_html/wp-includes/formatting.php on line 4371
Deprecated: Function get_magic_quotes_gpc() is deprecated in /home3/reasonan/public_html/wp-includes/formatting.php on line 4371
Deprecated: Function get_magic_quotes_gpc() is deprecated in /home3/reasonan/public_html/wp-includes/formatting.php on line 4371
Deprecated: Function get_magic_quotes_gpc() is deprecated in /home3/reasonan/public_html/wp-includes/formatting.php on line 4371
Deprecated: Function get_magic_quotes_gpc() is deprecated in /home3/reasonan/public_html/wp-includes/formatting.php on line 4371
Deprecated: Function get_magic_quotes_gpc() is deprecated in /home3/reasonan/public_html/wp-includes/formatting.php on line 4371
Deprecated: Function get_magic_quotes_gpc() is deprecated in /home3/reasonan/public_html/wp-includes/formatting.php on line 4371
Deprecated: Function get_magic_quotes_gpc() is deprecated in /home3/reasonan/public_html/wp-includes/formatting.php on line 4371
Deprecated: Function get_magic_quotes_gpc() is deprecated in /home3/reasonan/public_html/wp-includes/formatting.php on line 4371
Deprecated: Function get_magic_quotes_gpc() is deprecated in /home3/reasonan/public_html/wp-includes/formatting.php on line 4371
Deprecated: Function get_magic_quotes_gpc() is deprecated in /home3/reasonan/public_html/wp-includes/formatting.php on line 4371
Deprecated: Function get_magic_quotes_gpc() is deprecated in /home3/reasonan/public_html/wp-includes/formatting.php on line 4371
Deprecated: Function get_magic_quotes_gpc() is deprecated in /home3/reasonan/public_html/wp-includes/formatting.php on line 4371
Deprecated: Function get_magic_quotes_gpc() is deprecated in /home3/reasonan/public_html/wp-includes/formatting.php on line 4371
Deprecated: Function get_magic_quotes_gpc() is deprecated in /home3/reasonan/public_html/wp-includes/formatting.php on line 4371
Deprecated: Function get_magic_quotes_gpc() is deprecated in /home3/reasonan/public_html/wp-includes/formatting.php on line 4371
Deprecated: Function get_magic_quotes_gpc() is deprecated in /home3/reasonan/public_html/wp-includes/formatting.php on line 4371
Deprecated: Function get_magic_quotes_gpc() is deprecated in /home3/reasonan/public_html/wp-includes/formatting.php on line 4371
Deprecated: Function get_magic_quotes_gpc() is deprecated in /home3/reasonan/public_html/wp-includes/formatting.php on line 4371
Deprecated: Function get_magic_quotes_gpc() is deprecated in /home3/reasonan/public_html/wp-includes/formatting.php on line 4371
Deprecated: Function get_magic_quotes_gpc() is deprecated in /home3/reasonan/public_html/wp-includes/formatting.php on line 4371
Deprecated: Function get_magic_quotes_gpc() is deprecated in /home3/reasonan/public_html/wp-includes/formatting.php on line 4371
Deprecated: Function get_magic_quotes_gpc() is deprecated in /home3/reasonan/public_html/wp-includes/formatting.php on line 4371
Deprecated: Function get_magic_quotes_gpc() is deprecated in /home3/reasonan/public_html/wp-includes/formatting.php on line 4371
Deprecated: Function get_magic_quotes_gpc() is deprecated in /home3/reasonan/public_html/wp-includes/formatting.php on line 4371
Deprecated: Function get_magic_quotes_gpc() is deprecated in /home3/reasonan/public_html/wp-includes/formatting.php on line 4371
Deprecated: Function get_magic_quotes_gpc() is deprecated in /home3/reasonan/public_html/wp-includes/formatting.php on line 4371
Deprecated: Function get_magic_quotes_gpc() is deprecated in /home3/reasonan/public_html/wp-includes/formatting.php on line 4371
I was typing out solutions to an Algebra 2 assessment the other day. Question 3 on the assessment asks students to solve an equation involving absolute value. I began my solution with this… …and then launched into an algebraic confirmation of that solution. Now on the one hand, throwing a Desmos-generated graph into a “detailed solutions” handout is a great move because, well, just look at it. It’s beautiful. ... ]]>
Deprecated: Function get_magic_quotes_gpc() is deprecated in /home3/reasonan/public_html/wp-includes/formatting.php on line 4371
Deprecated: Function get_magic_quotes_gpc() is deprecated in /home3/reasonan/public_html/wp-includes/formatting.php on line 4371
Warning: count(): Parameter must be an array or an object that implements Countable in /home3/reasonan/public_html/wp-includes/media.php on line 1206
Deprecated: Function get_magic_quotes_gpc() is deprecated in /home3/reasonan/public_html/wp-includes/formatting.php on line 4371
Deprecated: Function get_magic_quotes_gpc() is deprecated in /home3/reasonan/public_html/wp-includes/formatting.php on line 4371
Warning: count(): Parameter must be an array or an object that implements Countable in /home3/reasonan/public_html/wp-includes/media.php on line 1206
Deprecated: Function get_magic_quotes_gpc() is deprecated in /home3/reasonan/public_html/wp-includes/formatting.php on line 2432
Deprecated: Function get_magic_quotes_gpc() is deprecated in /home3/reasonan/public_html/wp-includes/formatting.php on line 4371
Deprecated: Function get_magic_quotes_gpc() is deprecated in /home3/reasonan/public_html/wp-includes/formatting.php on line 4371
Deprecated: Function get_magic_quotes_gpc() is deprecated in /home3/reasonan/public_html/wp-includes/formatting.php on line 4371
Deprecated: Function get_magic_quotes_gpc() is deprecated in /home3/reasonan/public_html/wp-includes/formatting.php on line 4371
Deprecated: Function get_magic_quotes_gpc() is deprecated in /home3/reasonan/public_html/wp-includes/formatting.php on line 4371
Deprecated: Function get_magic_quotes_gpc() is deprecated in /home3/reasonan/public_html/wp-includes/formatting.php on line 4371
Deprecated: Function get_magic_quotes_gpc() is deprecated in /home3/reasonan/public_html/wp-includes/formatting.php on line 4371
Deprecated: Function get_magic_quotes_gpc() is deprecated in /home3/reasonan/public_html/wp-includes/formatting.php on line 4371
Deprecated: Function get_magic_quotes_gpc() is deprecated in /home3/reasonan/public_html/wp-includes/formatting.php on line 4371
Deprecated: Function get_magic_quotes_gpc() is deprecated in /home3/reasonan/public_html/wp-includes/formatting.php on line 4371
Deprecated: Function get_magic_quotes_gpc() is deprecated in /home3/reasonan/public_html/wp-includes/formatting.php on line 4371
Deprecated: Function get_magic_quotes_gpc() is deprecated in /home3/reasonan/public_html/wp-includes/formatting.php on line 4371
Deprecated: Function get_magic_quotes_gpc() is deprecated in /home3/reasonan/public_html/wp-includes/formatting.php on line 4371
Deprecated: Function get_magic_quotes_gpc() is deprecated in /home3/reasonan/public_html/wp-includes/formatting.php on line 4371
Deprecated: Function get_magic_quotes_gpc() is deprecated in /home3/reasonan/public_html/wp-includes/formatting.php on line 4371
Deprecated: Function get_magic_quotes_gpc() is deprecated in /home3/reasonan/public_html/wp-includes/formatting.php on line 4371
Deprecated: Function get_magic_quotes_gpc() is deprecated in /home3/reasonan/public_html/wp-includes/formatting.php on line 4371
Deprecated: Function get_magic_quotes_gpc() is deprecated in /home3/reasonan/public_html/wp-includes/formatting.php on line 4371
Deprecated: Function get_magic_quotes_gpc() is deprecated in /home3/reasonan/public_html/wp-includes/formatting.php on line 4371
Deprecated: Function get_magic_quotes_gpc() is deprecated in /home3/reasonan/public_html/wp-includes/formatting.php on line 4371
Deprecated: Function get_magic_quotes_gpc() is deprecated in /home3/reasonan/public_html/wp-includes/formatting.php on line 4371
Deprecated: Function get_magic_quotes_gpc() is deprecated in /home3/reasonan/public_html/wp-includes/formatting.php on line 4371
Deprecated: Function get_magic_quotes_gpc() is deprecated in /home3/reasonan/public_html/wp-includes/formatting.php on line 4371
Deprecated: Function get_magic_quotes_gpc() is deprecated in /home3/reasonan/public_html/wp-includes/formatting.php on line 4371
Deprecated: Function get_magic_quotes_gpc() is deprecated in /home3/reasonan/public_html/wp-includes/formatting.php on line 4371
Deprecated: Function get_magic_quotes_gpc() is deprecated in /home3/reasonan/public_html/wp-includes/formatting.php on line 4371
Deprecated: Function get_magic_quotes_gpc() is deprecated in /home3/reasonan/public_html/wp-includes/formatting.php on line 4371
Deprecated: Function get_magic_quotes_gpc() is deprecated in /home3/reasonan/public_html/wp-includes/formatting.php on line 4371
Deprecated: Function get_magic_quotes_gpc() is deprecated in /home3/reasonan/public_html/wp-includes/formatting.php on line 4371
Deprecated: Function get_magic_quotes_gpc() is deprecated in /home3/reasonan/public_html/wp-includes/formatting.php on line 4371
Deprecated: Function get_magic_quotes_gpc() is deprecated in /home3/reasonan/public_html/wp-includes/formatting.php on line 4371
Deprecated: Function get_magic_quotes_gpc() is deprecated in /home3/reasonan/public_html/wp-includes/formatting.php on line 4371
Deprecated: Function get_magic_quotes_gpc() is deprecated in /home3/reasonan/public_html/wp-includes/formatting.php on line 4371
Deprecated: Function get_magic_quotes_gpc() is deprecated in /home3/reasonan/public_html/wp-includes/formatting.php on line 4371
Deprecated: Function get_magic_quotes_gpc() is deprecated in /home3/reasonan/public_html/wp-includes/formatting.php on line 4371
Deprecated: Function get_magic_quotes_gpc() is deprecated in /home3/reasonan/public_html/wp-includes/formatting.php on line 4371
Deprecated: Function get_magic_quotes_gpc() is deprecated in /home3/reasonan/public_html/wp-includes/formatting.php on line 4371
Deprecated: Function get_magic_quotes_gpc() is deprecated in /home3/reasonan/public_html/wp-includes/formatting.php on line 4371
Deprecated: Function get_magic_quotes_gpc() is deprecated in /home3/reasonan/public_html/wp-includes/formatting.php on line 4371
Deprecated: Function get_magic_quotes_gpc() is deprecated in /home3/reasonan/public_html/wp-includes/formatting.php on line 4371
Deprecated: Function get_magic_quotes_gpc() is deprecated in /home3/reasonan/public_html/wp-includes/formatting.php on line 4371
Deprecated: Function get_magic_quotes_gpc() is deprecated in /home3/reasonan/public_html/wp-includes/formatting.php on line 4371
Deprecated: Function get_magic_quotes_gpc() is deprecated in /home3/reasonan/public_html/wp-includes/formatting.php on line 4371
Deprecated: Function get_magic_quotes_gpc() is deprecated in /home3/reasonan/public_html/wp-includes/formatting.php on line 4371

…and then launched into an algebraic confirmation of that solution.
Now on the one hand, throwing a Desmos-generated graph into a “detailed solutions” handout is a great move because, well, just look at it. It’s beautiful. And hey! Multiple representations! Plus it took about 30 seconds from start to finish. No brainer, right?
Well, on the other hand, including something like that is dangerous, because when you find yourself writing the solutions to questions 6 and 7 (as I did just a few moments later), and these questions ask for a graphical display of the solution to a one-variable linear inequality… Well now you’ve tasted greatness, and you won’t settle for anything else.
There’s just one problem: Desmos doesn’t do linear inequalities in one variable.
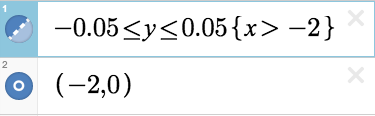
Okay, that last sentence is actually not true. Desmos will graph linear inequalities in one variable. You just have to ask nicely. Check it out:


I imagine I’m not the only one to do this (and it would still be pretty cool if Desmos would add one-variable number line graphing functionality… Pretty please?), but I thought I’d share how to do it anyway, just in case anyone is curious (and wants to give one-variable graphing a little Desmos-love).
Here’s How
The best way to explain is to throw a few images in here and let them do the talking. Drop me a line on Twitter (@mjfenton) or in the comments if you have any questions (or tips for how to make this even easier or more awesome). Or if your name is Eli and you have a new feature to announce.
Graph 1


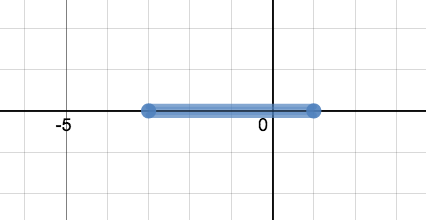
Graph 2


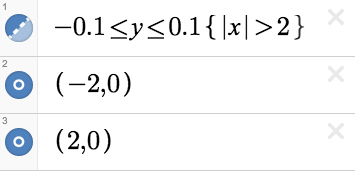
Graph 3


