Deprecated: Function get_magic_quotes_gpc() is deprecated in /home3/reasonan/public_html/wp-includes/formatting.php on line 4371
Deprecated: Function get_magic_quotes_gpc() is deprecated in /home3/reasonan/public_html/wp-includes/formatting.php on line 4371
Warning: count(): Parameter must be an array or an object that implements Countable in /home3/reasonan/public_html/wp-includes/media.php on line 1206
Deprecated: Function get_magic_quotes_gpc() is deprecated in /home3/reasonan/public_html/wp-includes/formatting.php on line 4371
Deprecated: Function get_magic_quotes_gpc() is deprecated in /home3/reasonan/public_html/wp-includes/formatting.php on line 4371
Deprecated: Function get_magic_quotes_gpc() is deprecated in /home3/reasonan/public_html/wp-includes/formatting.php on line 4371
Warning: count(): Parameter must be an array or an object that implements Countable in /home3/reasonan/public_html/wp-includes/media.php on line 1206
Deprecated: Function get_magic_quotes_gpc() is deprecated in /home3/reasonan/public_html/wp-includes/formatting.php on line 4371
Deprecated: Function get_magic_quotes_gpc() is deprecated in /home3/reasonan/public_html/wp-includes/formatting.php on line 4371
Warning: count(): Parameter must be an array or an object that implements Countable in /home3/reasonan/public_html/wp-includes/media.php on line 1206
Deprecated: Function get_magic_quotes_gpc() is deprecated in /home3/reasonan/public_html/wp-includes/formatting.php on line 2432
Deprecated: Function get_magic_quotes_gpc() is deprecated in /home3/reasonan/public_html/wp-includes/formatting.php on line 4371
Deprecated: Function get_magic_quotes_gpc() is deprecated in /home3/reasonan/public_html/wp-includes/formatting.php on line 4371
Deprecated: Function get_magic_quotes_gpc() is deprecated in /home3/reasonan/public_html/wp-includes/formatting.php on line 4371
Deprecated: Function get_magic_quotes_gpc() is deprecated in /home3/reasonan/public_html/wp-includes/formatting.php on line 4371
Deprecated: Function get_magic_quotes_gpc() is deprecated in /home3/reasonan/public_html/wp-includes/formatting.php on line 4371
Deprecated: Function get_magic_quotes_gpc() is deprecated in /home3/reasonan/public_html/wp-includes/formatting.php on line 4371
Deprecated: Function get_magic_quotes_gpc() is deprecated in /home3/reasonan/public_html/wp-includes/formatting.php on line 4371
Deprecated: Function get_magic_quotes_gpc() is deprecated in /home3/reasonan/public_html/wp-includes/formatting.php on line 4371
Deprecated: Function get_magic_quotes_gpc() is deprecated in /home3/reasonan/public_html/wp-includes/formatting.php on line 4371
Deprecated: Function get_magic_quotes_gpc() is deprecated in /home3/reasonan/public_html/wp-includes/formatting.php on line 4371
Deprecated: Function get_magic_quotes_gpc() is deprecated in /home3/reasonan/public_html/wp-includes/formatting.php on line 4371
Deprecated: Function get_magic_quotes_gpc() is deprecated in /home3/reasonan/public_html/wp-includes/formatting.php on line 4371
Deprecated: Function get_magic_quotes_gpc() is deprecated in /home3/reasonan/public_html/wp-includes/formatting.php on line 4371
Deprecated: Function get_magic_quotes_gpc() is deprecated in /home3/reasonan/public_html/wp-includes/formatting.php on line 4371
Deprecated: Function get_magic_quotes_gpc() is deprecated in /home3/reasonan/public_html/wp-includes/formatting.php on line 4371
Deprecated: Function get_magic_quotes_gpc() is deprecated in /home3/reasonan/public_html/wp-includes/formatting.php on line 4371
Deprecated: Function get_magic_quotes_gpc() is deprecated in /home3/reasonan/public_html/wp-includes/formatting.php on line 4371
Most of the work my students do with Visual Patterns occurs in small groups, where collaboration not only is encouraged, but often required. Today I steered things in a slightly different direction. I wanted to see what students were capable of on their own. No peer discussion. No Desmos. I was particularly interested to see whether they could write an equation to describe the relationship they see ... ]]>
Deprecated: Function get_magic_quotes_gpc() is deprecated in /home3/reasonan/public_html/wp-includes/formatting.php on line 4371
Deprecated: Function get_magic_quotes_gpc() is deprecated in /home3/reasonan/public_html/wp-includes/formatting.php on line 4371
Warning: count(): Parameter must be an array or an object that implements Countable in /home3/reasonan/public_html/wp-includes/media.php on line 1206
Deprecated: Function get_magic_quotes_gpc() is deprecated in /home3/reasonan/public_html/wp-includes/formatting.php on line 4371
Deprecated: Function get_magic_quotes_gpc() is deprecated in /home3/reasonan/public_html/wp-includes/formatting.php on line 4371
Deprecated: Function get_magic_quotes_gpc() is deprecated in /home3/reasonan/public_html/wp-includes/formatting.php on line 4371
Warning: count(): Parameter must be an array or an object that implements Countable in /home3/reasonan/public_html/wp-includes/media.php on line 1206
Deprecated: Function get_magic_quotes_gpc() is deprecated in /home3/reasonan/public_html/wp-includes/formatting.php on line 4371
Deprecated: Function get_magic_quotes_gpc() is deprecated in /home3/reasonan/public_html/wp-includes/formatting.php on line 4371
Warning: count(): Parameter must be an array or an object that implements Countable in /home3/reasonan/public_html/wp-includes/media.php on line 1206
Deprecated: Function get_magic_quotes_gpc() is deprecated in /home3/reasonan/public_html/wp-includes/formatting.php on line 2432
Deprecated: Function get_magic_quotes_gpc() is deprecated in /home3/reasonan/public_html/wp-includes/formatting.php on line 4371
Deprecated: Function get_magic_quotes_gpc() is deprecated in /home3/reasonan/public_html/wp-includes/formatting.php on line 4371
Deprecated: Function get_magic_quotes_gpc() is deprecated in /home3/reasonan/public_html/wp-includes/formatting.php on line 4371
Deprecated: Function get_magic_quotes_gpc() is deprecated in /home3/reasonan/public_html/wp-includes/formatting.php on line 4371
Deprecated: Function get_magic_quotes_gpc() is deprecated in /home3/reasonan/public_html/wp-includes/formatting.php on line 4371
Deprecated: Function get_magic_quotes_gpc() is deprecated in /home3/reasonan/public_html/wp-includes/formatting.php on line 4371
Deprecated: Function get_magic_quotes_gpc() is deprecated in /home3/reasonan/public_html/wp-includes/formatting.php on line 4371
Deprecated: Function get_magic_quotes_gpc() is deprecated in /home3/reasonan/public_html/wp-includes/formatting.php on line 4371
Deprecated: Function get_magic_quotes_gpc() is deprecated in /home3/reasonan/public_html/wp-includes/formatting.php on line 4371
Deprecated: Function get_magic_quotes_gpc() is deprecated in /home3/reasonan/public_html/wp-includes/formatting.php on line 4371
Deprecated: Function get_magic_quotes_gpc() is deprecated in /home3/reasonan/public_html/wp-includes/formatting.php on line 4371
Deprecated: Function get_magic_quotes_gpc() is deprecated in /home3/reasonan/public_html/wp-includes/formatting.php on line 4371
Deprecated: Function get_magic_quotes_gpc() is deprecated in /home3/reasonan/public_html/wp-includes/formatting.php on line 4371
Deprecated: Function get_magic_quotes_gpc() is deprecated in /home3/reasonan/public_html/wp-includes/formatting.php on line 4371
Deprecated: Function get_magic_quotes_gpc() is deprecated in /home3/reasonan/public_html/wp-includes/formatting.php on line 4371
Deprecated: Function get_magic_quotes_gpc() is deprecated in /home3/reasonan/public_html/wp-includes/formatting.php on line 4371

I wanted to see what students were capable of on their own. No peer discussion. No Desmos. I was particularly interested to see whether they could write an equation to describe the relationship they see unfolding visually, numerically, and graphically. Some could. Some could not.
As I walked throughout the room, I took note of the incorrect equations students were writing down. There were four in particular that caught my eye. Students were clearly doing some relevant work with calculating slope and (trying, anyway) to identify the y-intercept… However, the way they mashed it all together left something to be desired.
On the Fly…
So as my last few students were finishing their work, I threw together this slide, featuring the pattern they had been working with, four “out-in-the-wild” incorrect equations, and a not-so-accidental suggestion that one of the equations is correct (just to keep ’em on their toes):

We then took a blank sheet of printer paper, folded it in half, and unfolded it. Two workspaces on the front, and two on the back. We then filled each workspace with an equation as well as a table of the actual values…

…plus a show-your-thinking-on-the-page run through of each x-value, evaluated in the given equation.

In each case, the expression values didn’t match the actual values, and the equation proved to be an imposter. While this “let’s evaluate” approach was rather typical, and the discussion was somewhat predictable, the results were nevertheless quite powerful. The major issues we identified and addressed were:
- Students lacked a go-to strategy for verifying whether their equation was valid. It’s almost as if they viewed the progression (from numerical to algebraic) as a one-way street. Our conversation helped them see how to go from numerical to algebraic, and then back again to confirm. I probably should have equipped them with this skill some time ago. Better late than never.
- Students were working with some faulty y-intercept assumptions. The evidence suggests (and their comments confirm) that of those who got this wrong, most went hunting for the y-intercept where it’s often found: at the top of the table. “The y-intercept occurs when the x-value is zero…” is not something that has stuck with them, despite visual, verbal, and numerical attempts to drive that home. I’m cautiously optimistic that today’s conversation smashed that misconception for most students.
Side Benefit
While most students wrote an equation with a rate of change of 4 new circles per stage, I did have a few “slope stragglers” suggest equations like y = x + 4 and y = 10x + 4. As we evaluated multiple x-values in each of four equations, and left a record of our evaluating on the board, the similarities and differences rose to the surface. The connection between the coefficients of our faulty equations (1, 4, 4, and 10) and the common differences between expression results caused a few more light bulbs to turn on.
Future Use
We’ll continue to explore Visual Patterns in small groups most the time, but I think I’ll include a dose of individual formative assessment, followed by small-group or whole-class error analysis now and again. We unpacked a lot of misconceptions today, and made a number of valuable connections as well, all in a rather short period of time. Anything that draws out misconceptions so we can smash ’em to bits through class discussion is worth bringing back for an encore.
]]>Deprecated: Function get_magic_quotes_gpc() is deprecated in /home3/reasonan/public_html/wp-includes/formatting.php on line 4371
Deprecated: Function get_magic_quotes_gpc() is deprecated in /home3/reasonan/public_html/wp-includes/formatting.php on line 4371
Warning: count(): Parameter must be an array or an object that implements Countable in /home3/reasonan/public_html/wp-includes/media.php on line 1206
Deprecated: Function get_magic_quotes_gpc() is deprecated in /home3/reasonan/public_html/wp-includes/formatting.php on line 4371
Deprecated: Function get_magic_quotes_gpc() is deprecated in /home3/reasonan/public_html/wp-includes/formatting.php on line 4371
Warning: count(): Parameter must be an array or an object that implements Countable in /home3/reasonan/public_html/wp-includes/media.php on line 1206
Deprecated: Function get_magic_quotes_gpc() is deprecated in /home3/reasonan/public_html/wp-includes/formatting.php on line 2432
Deprecated: Function get_magic_quotes_gpc() is deprecated in /home3/reasonan/public_html/wp-includes/formatting.php on line 4371
Deprecated: Function get_magic_quotes_gpc() is deprecated in /home3/reasonan/public_html/wp-includes/formatting.php on line 4371
Deprecated: Function get_magic_quotes_gpc() is deprecated in /home3/reasonan/public_html/wp-includes/formatting.php on line 4371
Deprecated: Function get_magic_quotes_gpc() is deprecated in /home3/reasonan/public_html/wp-includes/formatting.php on line 4371
Deprecated: Function get_magic_quotes_gpc() is deprecated in /home3/reasonan/public_html/wp-includes/formatting.php on line 4371
Deprecated: Function get_magic_quotes_gpc() is deprecated in /home3/reasonan/public_html/wp-includes/formatting.php on line 4371
Deprecated: Function get_magic_quotes_gpc() is deprecated in /home3/reasonan/public_html/wp-includes/formatting.php on line 4371
Deprecated: Function get_magic_quotes_gpc() is deprecated in /home3/reasonan/public_html/wp-includes/formatting.php on line 4371
Deprecated: Function get_magic_quotes_gpc() is deprecated in /home3/reasonan/public_html/wp-includes/formatting.php on line 4371
Deprecated: Function get_magic_quotes_gpc() is deprecated in /home3/reasonan/public_html/wp-includes/formatting.php on line 4371
Deprecated: Function get_magic_quotes_gpc() is deprecated in /home3/reasonan/public_html/wp-includes/formatting.php on line 4371
Deprecated: Function get_magic_quotes_gpc() is deprecated in /home3/reasonan/public_html/wp-includes/formatting.php on line 4371
Deprecated: Function get_magic_quotes_gpc() is deprecated in /home3/reasonan/public_html/wp-includes/formatting.php on line 4371
Deprecated: Function get_magic_quotes_gpc() is deprecated in /home3/reasonan/public_html/wp-includes/formatting.php on line 4371
Deprecated: Function get_magic_quotes_gpc() is deprecated in /home3/reasonan/public_html/wp-includes/formatting.php on line 4371
Deprecated: Function get_magic_quotes_gpc() is deprecated in /home3/reasonan/public_html/wp-includes/formatting.php on line 4371
If the response to my post from Tuesday is any indication, people on the Internet Machine love Fawn Nguyen’s Visual Patterns. Let’s say you’re one of these folks, and your students are now rocking this sweet set of challenges. Now what?! Well, for one thing, don’t stop! These are rich enough problems to keep bringing them before your students. (In fact, the real fun begins when ... ]]>
Deprecated: Function get_magic_quotes_gpc() is deprecated in /home3/reasonan/public_html/wp-includes/formatting.php on line 4371
Deprecated: Function get_magic_quotes_gpc() is deprecated in /home3/reasonan/public_html/wp-includes/formatting.php on line 4371
Deprecated: Function get_magic_quotes_gpc() is deprecated in /home3/reasonan/public_html/wp-includes/formatting.php on line 4371
Warning: count(): Parameter must be an array or an object that implements Countable in /home3/reasonan/public_html/wp-includes/media.php on line 1206
Deprecated: Function get_magic_quotes_gpc() is deprecated in /home3/reasonan/public_html/wp-includes/formatting.php on line 4371
Deprecated: Function get_magic_quotes_gpc() is deprecated in /home3/reasonan/public_html/wp-includes/formatting.php on line 4371
Warning: count(): Parameter must be an array or an object that implements Countable in /home3/reasonan/public_html/wp-includes/media.php on line 1206
Deprecated: Function get_magic_quotes_gpc() is deprecated in /home3/reasonan/public_html/wp-includes/formatting.php on line 2432
Deprecated: Function get_magic_quotes_gpc() is deprecated in /home3/reasonan/public_html/wp-includes/formatting.php on line 4371
Deprecated: Function get_magic_quotes_gpc() is deprecated in /home3/reasonan/public_html/wp-includes/formatting.php on line 4371
Deprecated: Function get_magic_quotes_gpc() is deprecated in /home3/reasonan/public_html/wp-includes/formatting.php on line 4371
Deprecated: Function get_magic_quotes_gpc() is deprecated in /home3/reasonan/public_html/wp-includes/formatting.php on line 4371
Deprecated: Function get_magic_quotes_gpc() is deprecated in /home3/reasonan/public_html/wp-includes/formatting.php on line 4371
Deprecated: Function get_magic_quotes_gpc() is deprecated in /home3/reasonan/public_html/wp-includes/formatting.php on line 4371
Deprecated: Function get_magic_quotes_gpc() is deprecated in /home3/reasonan/public_html/wp-includes/formatting.php on line 4371
Deprecated: Function get_magic_quotes_gpc() is deprecated in /home3/reasonan/public_html/wp-includes/formatting.php on line 4371
Deprecated: Function get_magic_quotes_gpc() is deprecated in /home3/reasonan/public_html/wp-includes/formatting.php on line 4371
Deprecated: Function get_magic_quotes_gpc() is deprecated in /home3/reasonan/public_html/wp-includes/formatting.php on line 4371
Deprecated: Function get_magic_quotes_gpc() is deprecated in /home3/reasonan/public_html/wp-includes/formatting.php on line 4371
Deprecated: Function get_magic_quotes_gpc() is deprecated in /home3/reasonan/public_html/wp-includes/formatting.php on line 4371
Deprecated: Function get_magic_quotes_gpc() is deprecated in /home3/reasonan/public_html/wp-includes/formatting.php on line 4371
Deprecated: Function get_magic_quotes_gpc() is deprecated in /home3/reasonan/public_html/wp-includes/formatting.php on line 4371
Deprecated: Function get_magic_quotes_gpc() is deprecated in /home3/reasonan/public_html/wp-includes/formatting.php on line 4371
Deprecated: Function get_magic_quotes_gpc() is deprecated in /home3/reasonan/public_html/wp-includes/formatting.php on line 4371

Let’s say you’re one of these folks, and your students are now rocking this sweet set of challenges. Now what?!

Well, for one thing, don’t stop! These are rich enough problems to keep bringing them before your students. (In fact, the real fun begins when we break out quadratics, including my personal favorite: patterns involving triangular and other figurate numbers.)
A Means To Another End
But I would offer that Visual Patterns are not only an end in themselves, but also a means to another end.
- “An end in themselves” because, let’s face it, they’re awesome all on their own.
- “A means to another end” because they provide students with experience in approaching mathematics through multiple representations. And this visual-verbal-numerical-graphical-algebraic tag team effort translates to new scenarios far more powerfully than a single representation would.
This last point was on full display this morning in Math B (eighth grade) as my students worked on Dan Meyer’s High School Graduation task.
Here’s a sample of how things went down:


Look familiar? I sure hope so.
After several rounds of Visual Patterns, students have developed a framework for translating a text-dense, potentially-intimidating task into something they can explore, something they can understand. In fact, once students had the table of values (which was admittedly a team effort), they were off to the races.
While students in past years were able to answer some of the numerical questions (when did the name-reading begin/end), they typically struggled to do anything more than that, and were at a loss when it came to writing an equation to model the scenario.
A Well Worn Path
So why were my students this year able to hack it? Because we’ve worn that visual-verbal-numerical-graphical-algebraic path so well in just a couple of weeks that moving from one representation to the next—and turning back to make connections among various forms—is becoming second nature.
And while there’s more than one way to foster this kind of connected thinking, I’ve found Visual Patterns to be among the most engaging, powerful, and effective.
Postscript
As you can tell, I’ve had fun with Visual Patterns this week and last. I have one more post in me on this topic, then I promise I’ll shift my rambling to something else. 
Deprecated: Function get_magic_quotes_gpc() is deprecated in /home3/reasonan/public_html/wp-includes/formatting.php on line 4371
Warning: count(): Parameter must be an array or an object that implements Countable in /home3/reasonan/public_html/wp-includes/media.php on line 1206
Deprecated: Function get_magic_quotes_gpc() is deprecated in /home3/reasonan/public_html/wp-includes/formatting.php on line 4371
Deprecated: Function get_magic_quotes_gpc() is deprecated in /home3/reasonan/public_html/wp-includes/formatting.php on line 4371
Deprecated: Function get_magic_quotes_gpc() is deprecated in /home3/reasonan/public_html/wp-includes/formatting.php on line 4371
Warning: count(): Parameter must be an array or an object that implements Countable in /home3/reasonan/public_html/wp-includes/media.php on line 1206
Deprecated: Function get_magic_quotes_gpc() is deprecated in /home3/reasonan/public_html/wp-includes/formatting.php on line 4371
Deprecated: Function get_magic_quotes_gpc() is deprecated in /home3/reasonan/public_html/wp-includes/formatting.php on line 4371
Warning: count(): Parameter must be an array or an object that implements Countable in /home3/reasonan/public_html/wp-includes/media.php on line 1206
Deprecated: Function get_magic_quotes_gpc() is deprecated in /home3/reasonan/public_html/wp-includes/formatting.php on line 2432
Deprecated: Function get_magic_quotes_gpc() is deprecated in /home3/reasonan/public_html/wp-includes/formatting.php on line 4371
Deprecated: Function get_magic_quotes_gpc() is deprecated in /home3/reasonan/public_html/wp-includes/formatting.php on line 4371
Deprecated: Function get_magic_quotes_gpc() is deprecated in /home3/reasonan/public_html/wp-includes/formatting.php on line 4371
Deprecated: Function get_magic_quotes_gpc() is deprecated in /home3/reasonan/public_html/wp-includes/formatting.php on line 4371
Deprecated: Function get_magic_quotes_gpc() is deprecated in /home3/reasonan/public_html/wp-includes/formatting.php on line 4371
Deprecated: Function get_magic_quotes_gpc() is deprecated in /home3/reasonan/public_html/wp-includes/formatting.php on line 4371
Deprecated: Function get_magic_quotes_gpc() is deprecated in /home3/reasonan/public_html/wp-includes/formatting.php on line 4371
Deprecated: Function get_magic_quotes_gpc() is deprecated in /home3/reasonan/public_html/wp-includes/formatting.php on line 4371
Deprecated: Function get_magic_quotes_gpc() is deprecated in /home3/reasonan/public_html/wp-includes/formatting.php on line 4371
Deprecated: Function get_magic_quotes_gpc() is deprecated in /home3/reasonan/public_html/wp-includes/formatting.php on line 4371
Deprecated: Function get_magic_quotes_gpc() is deprecated in /home3/reasonan/public_html/wp-includes/formatting.php on line 4371
Deprecated: Function get_magic_quotes_gpc() is deprecated in /home3/reasonan/public_html/wp-includes/formatting.php on line 4371
Deprecated: Function get_magic_quotes_gpc() is deprecated in /home3/reasonan/public_html/wp-includes/formatting.php on line 4371
Deprecated: Function get_magic_quotes_gpc() is deprecated in /home3/reasonan/public_html/wp-includes/formatting.php on line 4371
Deprecated: Function get_magic_quotes_gpc() is deprecated in /home3/reasonan/public_html/wp-includes/formatting.php on line 4371
Deprecated: Function get_magic_quotes_gpc() is deprecated in /home3/reasonan/public_html/wp-includes/formatting.php on line 4371
Deprecated: Function get_magic_quotes_gpc() is deprecated in /home3/reasonan/public_html/wp-includes/formatting.php on line 4371
Deprecated: Function get_magic_quotes_gpc() is deprecated in /home3/reasonan/public_html/wp-includes/formatting.php on line 4371
Deprecated: Function get_magic_quotes_gpc() is deprecated in /home3/reasonan/public_html/wp-includes/formatting.php on line 4371
Deprecated: Function get_magic_quotes_gpc() is deprecated in /home3/reasonan/public_html/wp-includes/formatting.php on line 4371
Deprecated: Function get_magic_quotes_gpc() is deprecated in /home3/reasonan/public_html/wp-includes/formatting.php on line 4371
Deprecated: Function get_magic_quotes_gpc() is deprecated in /home3/reasonan/public_html/wp-includes/formatting.php on line 4371
Deprecated: Function get_magic_quotes_gpc() is deprecated in /home3/reasonan/public_html/wp-includes/formatting.php on line 4371
Deprecated: Function get_magic_quotes_gpc() is deprecated in /home3/reasonan/public_html/wp-includes/formatting.php on line 4371
Deprecated: Function get_magic_quotes_gpc() is deprecated in /home3/reasonan/public_html/wp-includes/formatting.php on line 4371
Deprecated: Function get_magic_quotes_gpc() is deprecated in /home3/reasonan/public_html/wp-includes/formatting.php on line 4371
Deprecated: Function get_magic_quotes_gpc() is deprecated in /home3/reasonan/public_html/wp-includes/formatting.php on line 4371
Deprecated: Function get_magic_quotes_gpc() is deprecated in /home3/reasonan/public_html/wp-includes/formatting.php on line 4371
Deprecated: Function get_magic_quotes_gpc() is deprecated in /home3/reasonan/public_html/wp-includes/formatting.php on line 4371
Deprecated: Function get_magic_quotes_gpc() is deprecated in /home3/reasonan/public_html/wp-includes/formatting.php on line 4371
Deprecated: Function get_magic_quotes_gpc() is deprecated in /home3/reasonan/public_html/wp-includes/formatting.php on line 4371
Deprecated: Function get_magic_quotes_gpc() is deprecated in /home3/reasonan/public_html/wp-includes/formatting.php on line 4371
Deprecated: Function get_magic_quotes_gpc() is deprecated in /home3/reasonan/public_html/wp-includes/formatting.php on line 4371
Deprecated: Function get_magic_quotes_gpc() is deprecated in /home3/reasonan/public_html/wp-includes/formatting.php on line 4371
Deprecated: Function get_magic_quotes_gpc() is deprecated in /home3/reasonan/public_html/wp-includes/formatting.php on line 4371
Deprecated: Function get_magic_quotes_gpc() is deprecated in /home3/reasonan/public_html/wp-includes/formatting.php on line 4371
Deprecated: Function get_magic_quotes_gpc() is deprecated in /home3/reasonan/public_html/wp-includes/formatting.php on line 4371
Deprecated: Function get_magic_quotes_gpc() is deprecated in /home3/reasonan/public_html/wp-includes/formatting.php on line 4371
Deprecated: Function get_magic_quotes_gpc() is deprecated in /home3/reasonan/public_html/wp-includes/formatting.php on line 4371
Deprecated: Function get_magic_quotes_gpc() is deprecated in /home3/reasonan/public_html/wp-includes/formatting.php on line 4371
Deprecated: Function get_magic_quotes_gpc() is deprecated in /home3/reasonan/public_html/wp-includes/formatting.php on line 4371
Deprecated: Function get_magic_quotes_gpc() is deprecated in /home3/reasonan/public_html/wp-includes/formatting.php on line 4371
Deprecated: Function get_magic_quotes_gpc() is deprecated in /home3/reasonan/public_html/wp-includes/formatting.php on line 4371
Deprecated: Function get_magic_quotes_gpc() is deprecated in /home3/reasonan/public_html/wp-includes/formatting.php on line 4371
Deprecated: Function get_magic_quotes_gpc() is deprecated in /home3/reasonan/public_html/wp-includes/formatting.php on line 4371
Deprecated: Function get_magic_quotes_gpc() is deprecated in /home3/reasonan/public_html/wp-includes/formatting.php on line 4371
Deprecated: Function get_magic_quotes_gpc() is deprecated in /home3/reasonan/public_html/wp-includes/formatting.php on line 4371
Deprecated: Function get_magic_quotes_gpc() is deprecated in /home3/reasonan/public_html/wp-includes/formatting.php on line 4371
I’ve been a fan of Fawn Nguyen’s visualpatterns.org for several years. I use resources from the website on a regular basis in my own classroom and in teacher training. The conversations are always excellent, and the emphasis on multiple-representations is a huge benefit to students wrestling with ideas in an all-too-often isolated context. (Plus, creating your own patterns is a blast!) ... ]]>
Deprecated: Function get_magic_quotes_gpc() is deprecated in /home3/reasonan/public_html/wp-includes/formatting.php on line 4371
Deprecated: Function get_magic_quotes_gpc() is deprecated in /home3/reasonan/public_html/wp-includes/formatting.php on line 4371
Warning: count(): Parameter must be an array or an object that implements Countable in /home3/reasonan/public_html/wp-includes/media.php on line 1206
Deprecated: Function get_magic_quotes_gpc() is deprecated in /home3/reasonan/public_html/wp-includes/formatting.php on line 4371
Deprecated: Function get_magic_quotes_gpc() is deprecated in /home3/reasonan/public_html/wp-includes/formatting.php on line 4371
Deprecated: Function get_magic_quotes_gpc() is deprecated in /home3/reasonan/public_html/wp-includes/formatting.php on line 4371
Warning: count(): Parameter must be an array or an object that implements Countable in /home3/reasonan/public_html/wp-includes/media.php on line 1206
Deprecated: Function get_magic_quotes_gpc() is deprecated in /home3/reasonan/public_html/wp-includes/formatting.php on line 4371
Deprecated: Function get_magic_quotes_gpc() is deprecated in /home3/reasonan/public_html/wp-includes/formatting.php on line 4371
Warning: count(): Parameter must be an array or an object that implements Countable in /home3/reasonan/public_html/wp-includes/media.php on line 1206
Deprecated: Function get_magic_quotes_gpc() is deprecated in /home3/reasonan/public_html/wp-includes/formatting.php on line 2432
Deprecated: Function get_magic_quotes_gpc() is deprecated in /home3/reasonan/public_html/wp-includes/formatting.php on line 4371
Deprecated: Function get_magic_quotes_gpc() is deprecated in /home3/reasonan/public_html/wp-includes/formatting.php on line 4371
Deprecated: Function get_magic_quotes_gpc() is deprecated in /home3/reasonan/public_html/wp-includes/formatting.php on line 4371
Deprecated: Function get_magic_quotes_gpc() is deprecated in /home3/reasonan/public_html/wp-includes/formatting.php on line 4371
Deprecated: Function get_magic_quotes_gpc() is deprecated in /home3/reasonan/public_html/wp-includes/formatting.php on line 4371
Deprecated: Function get_magic_quotes_gpc() is deprecated in /home3/reasonan/public_html/wp-includes/formatting.php on line 4371
Deprecated: Function get_magic_quotes_gpc() is deprecated in /home3/reasonan/public_html/wp-includes/formatting.php on line 4371
Deprecated: Function get_magic_quotes_gpc() is deprecated in /home3/reasonan/public_html/wp-includes/formatting.php on line 4371
Deprecated: Function get_magic_quotes_gpc() is deprecated in /home3/reasonan/public_html/wp-includes/formatting.php on line 4371
Deprecated: Function get_magic_quotes_gpc() is deprecated in /home3/reasonan/public_html/wp-includes/formatting.php on line 4371
Deprecated: Function get_magic_quotes_gpc() is deprecated in /home3/reasonan/public_html/wp-includes/formatting.php on line 4371
Deprecated: Function get_magic_quotes_gpc() is deprecated in /home3/reasonan/public_html/wp-includes/formatting.php on line 4371
Deprecated: Function get_magic_quotes_gpc() is deprecated in /home3/reasonan/public_html/wp-includes/formatting.php on line 4371
Deprecated: Function get_magic_quotes_gpc() is deprecated in /home3/reasonan/public_html/wp-includes/formatting.php on line 4371
Deprecated: Function get_magic_quotes_gpc() is deprecated in /home3/reasonan/public_html/wp-includes/formatting.php on line 4371
Deprecated: Function get_magic_quotes_gpc() is deprecated in /home3/reasonan/public_html/wp-includes/formatting.php on line 4371
Deprecated: Function get_magic_quotes_gpc() is deprecated in /home3/reasonan/public_html/wp-includes/formatting.php on line 4371
Deprecated: Function get_magic_quotes_gpc() is deprecated in /home3/reasonan/public_html/wp-includes/formatting.php on line 4371
Deprecated: Function get_magic_quotes_gpc() is deprecated in /home3/reasonan/public_html/wp-includes/formatting.php on line 4371
Deprecated: Function get_magic_quotes_gpc() is deprecated in /home3/reasonan/public_html/wp-includes/formatting.php on line 4371
Deprecated: Function get_magic_quotes_gpc() is deprecated in /home3/reasonan/public_html/wp-includes/formatting.php on line 4371
Deprecated: Function get_magic_quotes_gpc() is deprecated in /home3/reasonan/public_html/wp-includes/formatting.php on line 4371
Deprecated: Function get_magic_quotes_gpc() is deprecated in /home3/reasonan/public_html/wp-includes/formatting.php on line 4371
Deprecated: Function get_magic_quotes_gpc() is deprecated in /home3/reasonan/public_html/wp-includes/formatting.php on line 4371
Deprecated: Function get_magic_quotes_gpc() is deprecated in /home3/reasonan/public_html/wp-includes/formatting.php on line 4371
Deprecated: Function get_magic_quotes_gpc() is deprecated in /home3/reasonan/public_html/wp-includes/formatting.php on line 4371
Deprecated: Function get_magic_quotes_gpc() is deprecated in /home3/reasonan/public_html/wp-includes/formatting.php on line 4371
Deprecated: Function get_magic_quotes_gpc() is deprecated in /home3/reasonan/public_html/wp-includes/formatting.php on line 4371
Deprecated: Function get_magic_quotes_gpc() is deprecated in /home3/reasonan/public_html/wp-includes/formatting.php on line 4371
Deprecated: Function get_magic_quotes_gpc() is deprecated in /home3/reasonan/public_html/wp-includes/formatting.php on line 4371
Deprecated: Function get_magic_quotes_gpc() is deprecated in /home3/reasonan/public_html/wp-includes/formatting.php on line 4371
Deprecated: Function get_magic_quotes_gpc() is deprecated in /home3/reasonan/public_html/wp-includes/formatting.php on line 4371
Deprecated: Function get_magic_quotes_gpc() is deprecated in /home3/reasonan/public_html/wp-includes/formatting.php on line 4371
Deprecated: Function get_magic_quotes_gpc() is deprecated in /home3/reasonan/public_html/wp-includes/formatting.php on line 4371
Deprecated: Function get_magic_quotes_gpc() is deprecated in /home3/reasonan/public_html/wp-includes/formatting.php on line 4371
Deprecated: Function get_magic_quotes_gpc() is deprecated in /home3/reasonan/public_html/wp-includes/formatting.php on line 4371
Deprecated: Function get_magic_quotes_gpc() is deprecated in /home3/reasonan/public_html/wp-includes/formatting.php on line 4371
Deprecated: Function get_magic_quotes_gpc() is deprecated in /home3/reasonan/public_html/wp-includes/formatting.php on line 4371
Deprecated: Function get_magic_quotes_gpc() is deprecated in /home3/reasonan/public_html/wp-includes/formatting.php on line 4371
Deprecated: Function get_magic_quotes_gpc() is deprecated in /home3/reasonan/public_html/wp-includes/formatting.php on line 4371
Deprecated: Function get_magic_quotes_gpc() is deprecated in /home3/reasonan/public_html/wp-includes/formatting.php on line 4371
Deprecated: Function get_magic_quotes_gpc() is deprecated in /home3/reasonan/public_html/wp-includes/formatting.php on line 4371
Deprecated: Function get_magic_quotes_gpc() is deprecated in /home3/reasonan/public_html/wp-includes/formatting.php on line 4371
Deprecated: Function get_magic_quotes_gpc() is deprecated in /home3/reasonan/public_html/wp-includes/formatting.php on line 4371
Deprecated: Function get_magic_quotes_gpc() is deprecated in /home3/reasonan/public_html/wp-includes/formatting.php on line 4371
Deprecated: Function get_magic_quotes_gpc() is deprecated in /home3/reasonan/public_html/wp-includes/formatting.php on line 4371
Deprecated: Function get_magic_quotes_gpc() is deprecated in /home3/reasonan/public_html/wp-includes/formatting.php on line 4371
Deprecated: Function get_magic_quotes_gpc() is deprecated in /home3/reasonan/public_html/wp-includes/formatting.php on line 4371

I took the reins for a middle school math class a few weeks ago. Our emphasis for the past couple of weeks has been CCSS.8.F, and linear-based visual patterns have been a key part of our exploration.
I’ve abandoned Fawn’s original handout, and even the modified version I created a couple years ago, and instead launch each visual pattern by having students fold a blank sheet of paper into quarters.
The other element I’ve incorporated into my visual patterns routine this year: Desmos.
The New Play-by-Play
Here’s how Visual Patterns plays out in my classroom these days:
1. Setup
Distribute a clean 8.5 by 11 inch sheet of printer paper to each student. Students fold the paper in quarters, then unfold.

The beauty here is that my preparation for visual patterns no longer involves a trip to the copier. Instead, I grab a ream of paper, three-hole the whole stack, and we’re ready to rock for quite some time.
2. Draw What You See
Next, I display—one at a time—the images for Stages 1-3. Students are required to draw each stage in one quarter of their paper.

My goal for these three rounds of “draw what you see” is to force students to attend the the structural details of the pattern before they begin extending the pattern visually or describing the structure verbally.
3. Predict and Describe What’s Next
Next, I display the following…

…and ask students to sketch and describe Stage 4. Their recent investment in observing the structure of Stages 1-3 usually pays dividends in Stage 4, both in making the predictive sketch and in describing their rationale.

After a moment or two, I collect a few responses, recording them in a Keynote slide. (Note: I only do this for some of the challenges.)
4. Fast Forward to Stage 10
This is where the rubber meets the road. Can students extend the pattern beyond simply “the next one”?
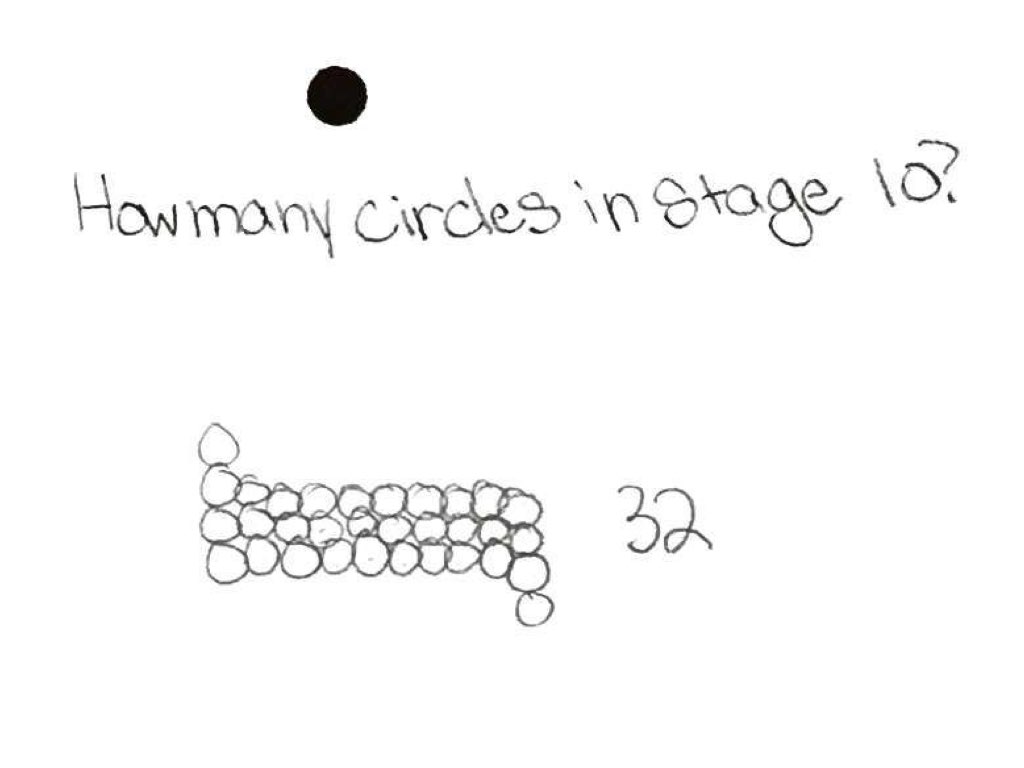
We flip the paper over and use the top left quarter as work space for figuring out how many items are in Stage 10. Some students sketch the image. Others wrestle numerically. Others skip this quarter for a time until they’ve done more work elsewhere.
5. Represent!
As I mentioned above, one of my favorite things about Visual Patterns is the way these mini-tasks lend themselves to multiple representations. Here’s what we do with the remaining quarters on the back:
Make a table (and find the rate of change, for linear patterns):
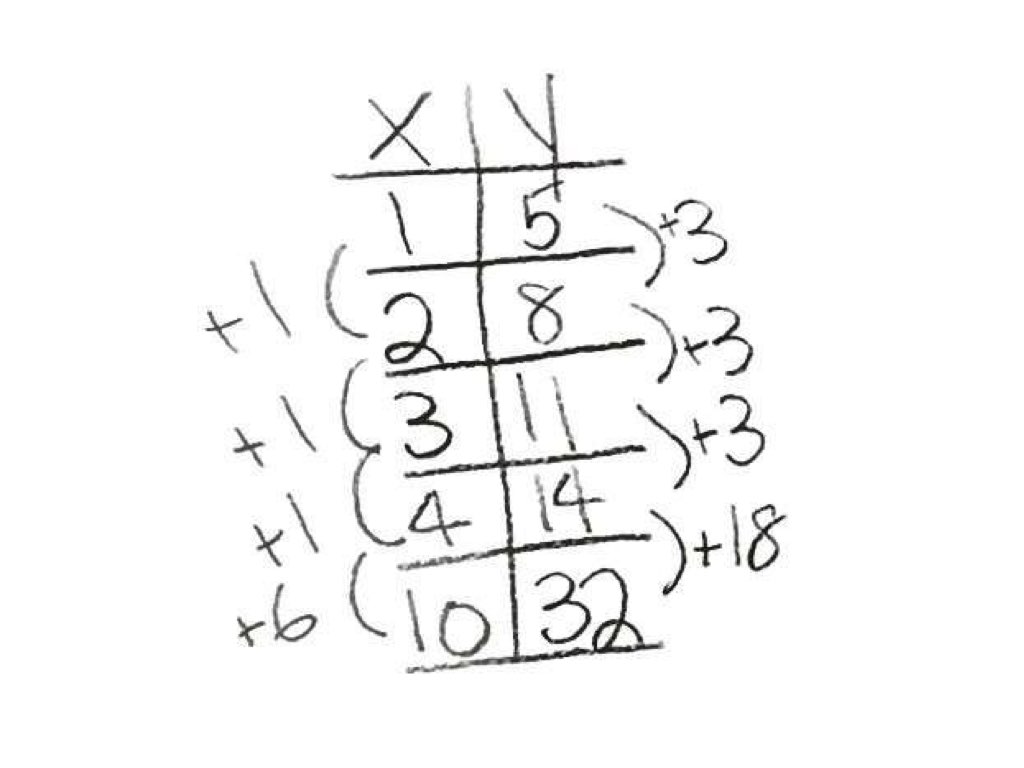
Sketch the graph:

Write an equation:

6. Desmos!
At some point, students fire up Desmos on a phone, tablet, or laptop to confirm their results.

Aside from general Desmos-awesomeness, there are a few specific benefits here:
- Students confirm the numerical work they’ve summarized in the table. Errors in a sequence are often easier to spot in graphical form than numerical form. Adding a table to the expression list while keeping an eye on the coordinate plane helps students identify potential errors in pattern-extending and/or arithmetic.
- Students confirm the equation they’ve found actually fits the numerical data. I derive more than a little satisfaction from watching a line or curve pass through a set of ordered pairs? Based on my students’ reactions, I am not the only one.
- Students tweak the window in order to confirm and/or help create their on-paper graphical representation. I’ve encouraged students to apply the “fill the frame” advice heard in photography circles as they make their window adjustments.
The End Result
I use Scannable (a free iOS app from Evernote that makes scanning and saving dead-simple) to capture 2-3 samples of student work. Here’s one in its entirety:

