Deprecated: Function get_magic_quotes_gpc() is deprecated in /home3/reasonan/public_html/wp-includes/formatting.php on line 4371
Deprecated: Function get_magic_quotes_gpc() is deprecated in /home3/reasonan/public_html/wp-includes/formatting.php on line 4371
Deprecated: Function get_magic_quotes_gpc() is deprecated in /home3/reasonan/public_html/wp-includes/formatting.php on line 4371
Deprecated: Function get_magic_quotes_gpc() is deprecated in /home3/reasonan/public_html/wp-includes/formatting.php on line 4371
Deprecated: Function get_magic_quotes_gpc() is deprecated in /home3/reasonan/public_html/wp-includes/formatting.php on line 4371
Deprecated: Function get_magic_quotes_gpc() is deprecated in /home3/reasonan/public_html/wp-includes/formatting.php on line 4371
Warning: count(): Parameter must be an array or an object that implements Countable in /home3/reasonan/public_html/wp-includes/media.php on line 1206
Deprecated: Function get_magic_quotes_gpc() is deprecated in /home3/reasonan/public_html/wp-includes/formatting.php on line 4371
Deprecated: Function get_magic_quotes_gpc() is deprecated in /home3/reasonan/public_html/wp-includes/formatting.php on line 4371
Deprecated: Function get_magic_quotes_gpc() is deprecated in /home3/reasonan/public_html/wp-includes/formatting.php on line 4371
Deprecated: Function get_magic_quotes_gpc() is deprecated in /home3/reasonan/public_html/wp-includes/formatting.php on line 4371
Deprecated: Function get_magic_quotes_gpc() is deprecated in /home3/reasonan/public_html/wp-includes/formatting.php on line 4371
Warning: count(): Parameter must be an array or an object that implements Countable in /home3/reasonan/public_html/wp-includes/media.php on line 1206
Deprecated: Function get_magic_quotes_gpc() is deprecated in /home3/reasonan/public_html/wp-includes/formatting.php on line 2432
Deprecated: Function get_magic_quotes_gpc() is deprecated in /home3/reasonan/public_html/wp-includes/formatting.php on line 4371
Deprecated: Function get_magic_quotes_gpc() is deprecated in /home3/reasonan/public_html/wp-includes/formatting.php on line 4371
Deprecated: Function get_magic_quotes_gpc() is deprecated in /home3/reasonan/public_html/wp-includes/formatting.php on line 4371
Deprecated: Function get_magic_quotes_gpc() is deprecated in /home3/reasonan/public_html/wp-includes/formatting.php on line 4371
Deprecated: Function get_magic_quotes_gpc() is deprecated in /home3/reasonan/public_html/wp-includes/formatting.php on line 4371
Deprecated: Function get_magic_quotes_gpc() is deprecated in /home3/reasonan/public_html/wp-includes/formatting.php on line 4371
Deprecated: Function get_magic_quotes_gpc() is deprecated in /home3/reasonan/public_html/wp-includes/formatting.php on line 4371
Deprecated: Function get_magic_quotes_gpc() is deprecated in /home3/reasonan/public_html/wp-includes/formatting.php on line 4371
Deprecated: Function get_magic_quotes_gpc() is deprecated in /home3/reasonan/public_html/wp-includes/formatting.php on line 4371
After an introduction and exploration (which I wrote about here and here) to my polar graphing unit, I wanted to steer our attention in a more algebraic direction so we could establish some connections between polar and Cartesian forms. On top of that, I needed an activity that would work well with a sub. The intersection of those wants and needs? A ... ]]>
Deprecated: Function get_magic_quotes_gpc() is deprecated in /home3/reasonan/public_html/wp-includes/formatting.php on line 4371
Deprecated: Function get_magic_quotes_gpc() is deprecated in /home3/reasonan/public_html/wp-includes/formatting.php on line 4371
Deprecated: Function get_magic_quotes_gpc() is deprecated in /home3/reasonan/public_html/wp-includes/formatting.php on line 4371
Deprecated: Function get_magic_quotes_gpc() is deprecated in /home3/reasonan/public_html/wp-includes/formatting.php on line 4371
Deprecated: Function get_magic_quotes_gpc() is deprecated in /home3/reasonan/public_html/wp-includes/formatting.php on line 4371
Deprecated: Function get_magic_quotes_gpc() is deprecated in /home3/reasonan/public_html/wp-includes/formatting.php on line 4371
Warning: count(): Parameter must be an array or an object that implements Countable in /home3/reasonan/public_html/wp-includes/media.php on line 1206
Deprecated: Function get_magic_quotes_gpc() is deprecated in /home3/reasonan/public_html/wp-includes/formatting.php on line 4371
Deprecated: Function get_magic_quotes_gpc() is deprecated in /home3/reasonan/public_html/wp-includes/formatting.php on line 4371
Deprecated: Function get_magic_quotes_gpc() is deprecated in /home3/reasonan/public_html/wp-includes/formatting.php on line 4371
Deprecated: Function get_magic_quotes_gpc() is deprecated in /home3/reasonan/public_html/wp-includes/formatting.php on line 4371
Deprecated: Function get_magic_quotes_gpc() is deprecated in /home3/reasonan/public_html/wp-includes/formatting.php on line 4371
Warning: count(): Parameter must be an array or an object that implements Countable in /home3/reasonan/public_html/wp-includes/media.php on line 1206
Deprecated: Function get_magic_quotes_gpc() is deprecated in /home3/reasonan/public_html/wp-includes/formatting.php on line 2432
Deprecated: Function get_magic_quotes_gpc() is deprecated in /home3/reasonan/public_html/wp-includes/formatting.php on line 4371
Deprecated: Function get_magic_quotes_gpc() is deprecated in /home3/reasonan/public_html/wp-includes/formatting.php on line 4371
Deprecated: Function get_magic_quotes_gpc() is deprecated in /home3/reasonan/public_html/wp-includes/formatting.php on line 4371
Deprecated: Function get_magic_quotes_gpc() is deprecated in /home3/reasonan/public_html/wp-includes/formatting.php on line 4371
Deprecated: Function get_magic_quotes_gpc() is deprecated in /home3/reasonan/public_html/wp-includes/formatting.php on line 4371
Deprecated: Function get_magic_quotes_gpc() is deprecated in /home3/reasonan/public_html/wp-includes/formatting.php on line 4371
Deprecated: Function get_magic_quotes_gpc() is deprecated in /home3/reasonan/public_html/wp-includes/formatting.php on line 4371
Deprecated: Function get_magic_quotes_gpc() is deprecated in /home3/reasonan/public_html/wp-includes/formatting.php on line 4371
On top of that, I needed an activity that would work well with a sub. The intersection of those wants and needs? A sorting activity!


Print ’em out, slice ’em up, throw ’em in a Ziploc and we’re ready for action.
Students worked in small groups on the following:
- Plot the polar equations in Desmos.
- Plot the Cartesian equations in Desmos.
- Match each graph with its polar and Cartesian equations.
- Match each graph description with its cards (polar equation/Cartesian equation/graph).
I challenged students to be on the lookout for connections between the two equation forms. This is something we’ll develop further in an upcoming lesson.
But Wait, There’s More!
Sorting activities are great because they often prompt lots of discussion within the groups. However, they’re sometimes short and sweet. With that in mind, I prepared another sub-proof task for my students: A pair of equation-converting examples, followed by several practice problems. If you’re curious to see the handout, which is seriously limited in focus/scope) click here.
Looking for the sorting activity slide deck instead?
]]>Deprecated: Function get_magic_quotes_gpc() is deprecated in /home3/reasonan/public_html/wp-includes/formatting.php on line 4371
Deprecated: Function get_magic_quotes_gpc() is deprecated in /home3/reasonan/public_html/wp-includes/formatting.php on line 4371
Warning: count(): Parameter must be an array or an object that implements Countable in /home3/reasonan/public_html/wp-includes/media.php on line 1206
Deprecated: Function get_magic_quotes_gpc() is deprecated in /home3/reasonan/public_html/wp-includes/formatting.php on line 4371
Deprecated: Function get_magic_quotes_gpc() is deprecated in /home3/reasonan/public_html/wp-includes/formatting.php on line 4371
Deprecated: Function get_magic_quotes_gpc() is deprecated in /home3/reasonan/public_html/wp-includes/formatting.php on line 4371
Deprecated: Function get_magic_quotes_gpc() is deprecated in /home3/reasonan/public_html/wp-includes/formatting.php on line 4371
Deprecated: Function get_magic_quotes_gpc() is deprecated in /home3/reasonan/public_html/wp-includes/formatting.php on line 4371
Deprecated: Function get_magic_quotes_gpc() is deprecated in /home3/reasonan/public_html/wp-includes/formatting.php on line 4371
Warning: count(): Parameter must be an array or an object that implements Countable in /home3/reasonan/public_html/wp-includes/media.php on line 1206
Deprecated: Function get_magic_quotes_gpc() is deprecated in /home3/reasonan/public_html/wp-includes/formatting.php on line 2432
Deprecated: Function get_magic_quotes_gpc() is deprecated in /home3/reasonan/public_html/wp-includes/formatting.php on line 4371
Deprecated: Function get_magic_quotes_gpc() is deprecated in /home3/reasonan/public_html/wp-includes/formatting.php on line 4371
Deprecated: Function get_magic_quotes_gpc() is deprecated in /home3/reasonan/public_html/wp-includes/formatting.php on line 4371
Deprecated: Function get_magic_quotes_gpc() is deprecated in /home3/reasonan/public_html/wp-includes/formatting.php on line 4371
Deprecated: Function get_magic_quotes_gpc() is deprecated in /home3/reasonan/public_html/wp-includes/formatting.php on line 4371
Deprecated: Function get_magic_quotes_gpc() is deprecated in /home3/reasonan/public_html/wp-includes/formatting.php on line 4371
Deprecated: Function get_magic_quotes_gpc() is deprecated in /home3/reasonan/public_html/wp-includes/formatting.php on line 4371
Deprecated: Function get_magic_quotes_gpc() is deprecated in /home3/reasonan/public_html/wp-includes/formatting.php on line 4371
Deprecated: Function get_magic_quotes_gpc() is deprecated in /home3/reasonan/public_html/wp-includes/formatting.php on line 4371
Deprecated: Function get_magic_quotes_gpc() is deprecated in /home3/reasonan/public_html/wp-includes/formatting.php on line 4371
Deprecated: Function get_magic_quotes_gpc() is deprecated in /home3/reasonan/public_html/wp-includes/formatting.php on line 4371
Deprecated: Function get_magic_quotes_gpc() is deprecated in /home3/reasonan/public_html/wp-includes/formatting.php on line 4371
Deprecated: Function get_magic_quotes_gpc() is deprecated in /home3/reasonan/public_html/wp-includes/formatting.php on line 4371
Deprecated: Function get_magic_quotes_gpc() is deprecated in /home3/reasonan/public_html/wp-includes/formatting.php on line 4371
Deprecated: Function get_magic_quotes_gpc() is deprecated in /home3/reasonan/public_html/wp-includes/formatting.php on line 4371
Deprecated: Function get_magic_quotes_gpc() is deprecated in /home3/reasonan/public_html/wp-includes/formatting.php on line 4371
Deprecated: Function get_magic_quotes_gpc() is deprecated in /home3/reasonan/public_html/wp-includes/formatting.php on line 4371
Deprecated: Function get_magic_quotes_gpc() is deprecated in /home3/reasonan/public_html/wp-includes/formatting.php on line 4371
Deprecated: Function get_magic_quotes_gpc() is deprecated in /home3/reasonan/public_html/wp-includes/formatting.php on line 4371
Deprecated: Function get_magic_quotes_gpc() is deprecated in /home3/reasonan/public_html/wp-includes/formatting.php on line 4371
Deprecated: Function get_magic_quotes_gpc() is deprecated in /home3/reasonan/public_html/wp-includes/formatting.php on line 4371
Deprecated: Function get_magic_quotes_gpc() is deprecated in /home3/reasonan/public_html/wp-includes/formatting.php on line 4371
Deprecated: Function get_magic_quotes_gpc() is deprecated in /home3/reasonan/public_html/wp-includes/formatting.php on line 4371
Deprecated: Function get_magic_quotes_gpc() is deprecated in /home3/reasonan/public_html/wp-includes/formatting.php on line 4371
Deprecated: Function get_magic_quotes_gpc() is deprecated in /home3/reasonan/public_html/wp-includes/formatting.php on line 4371
Deprecated: Function get_magic_quotes_gpc() is deprecated in /home3/reasonan/public_html/wp-includes/formatting.php on line 4371
Deprecated: Function get_magic_quotes_gpc() is deprecated in /home3/reasonan/public_html/wp-includes/formatting.php on line 4371
Deprecated: Function get_magic_quotes_gpc() is deprecated in /home3/reasonan/public_html/wp-includes/formatting.php on line 4371
Over the weekend I wrote about an alternative launch to my Precalculus polar graphing unit. After that first lesson, I decided to throw out my usual “Day 2 Notes” and replaced them with a six-part, Desmos-driven exploration. I started by having students fire up Desmos, working in a 2:1 arrangement (two students per screen). While they got that ready to go, I distributed a stack ... ]]>
Deprecated: Function get_magic_quotes_gpc() is deprecated in /home3/reasonan/public_html/wp-includes/formatting.php on line 4371
Deprecated: Function get_magic_quotes_gpc() is deprecated in /home3/reasonan/public_html/wp-includes/formatting.php on line 4371
Deprecated: Function get_magic_quotes_gpc() is deprecated in /home3/reasonan/public_html/wp-includes/formatting.php on line 4371
Warning: count(): Parameter must be an array or an object that implements Countable in /home3/reasonan/public_html/wp-includes/media.php on line 1206
Deprecated: Function get_magic_quotes_gpc() is deprecated in /home3/reasonan/public_html/wp-includes/formatting.php on line 4371
Deprecated: Function get_magic_quotes_gpc() is deprecated in /home3/reasonan/public_html/wp-includes/formatting.php on line 4371
Deprecated: Function get_magic_quotes_gpc() is deprecated in /home3/reasonan/public_html/wp-includes/formatting.php on line 4371
Deprecated: Function get_magic_quotes_gpc() is deprecated in /home3/reasonan/public_html/wp-includes/formatting.php on line 4371
Deprecated: Function get_magic_quotes_gpc() is deprecated in /home3/reasonan/public_html/wp-includes/formatting.php on line 4371
Deprecated: Function get_magic_quotes_gpc() is deprecated in /home3/reasonan/public_html/wp-includes/formatting.php on line 4371
Warning: count(): Parameter must be an array or an object that implements Countable in /home3/reasonan/public_html/wp-includes/media.php on line 1206
Deprecated: Function get_magic_quotes_gpc() is deprecated in /home3/reasonan/public_html/wp-includes/formatting.php on line 2432
Deprecated: Function get_magic_quotes_gpc() is deprecated in /home3/reasonan/public_html/wp-includes/formatting.php on line 4371
Deprecated: Function get_magic_quotes_gpc() is deprecated in /home3/reasonan/public_html/wp-includes/formatting.php on line 4371
Deprecated: Function get_magic_quotes_gpc() is deprecated in /home3/reasonan/public_html/wp-includes/formatting.php on line 4371
Deprecated: Function get_magic_quotes_gpc() is deprecated in /home3/reasonan/public_html/wp-includes/formatting.php on line 4371
Deprecated: Function get_magic_quotes_gpc() is deprecated in /home3/reasonan/public_html/wp-includes/formatting.php on line 4371
Deprecated: Function get_magic_quotes_gpc() is deprecated in /home3/reasonan/public_html/wp-includes/formatting.php on line 4371
Deprecated: Function get_magic_quotes_gpc() is deprecated in /home3/reasonan/public_html/wp-includes/formatting.php on line 4371
Deprecated: Function get_magic_quotes_gpc() is deprecated in /home3/reasonan/public_html/wp-includes/formatting.php on line 4371
Deprecated: Function get_magic_quotes_gpc() is deprecated in /home3/reasonan/public_html/wp-includes/formatting.php on line 4371
Deprecated: Function get_magic_quotes_gpc() is deprecated in /home3/reasonan/public_html/wp-includes/formatting.php on line 4371
Deprecated: Function get_magic_quotes_gpc() is deprecated in /home3/reasonan/public_html/wp-includes/formatting.php on line 4371
Deprecated: Function get_magic_quotes_gpc() is deprecated in /home3/reasonan/public_html/wp-includes/formatting.php on line 4371
Deprecated: Function get_magic_quotes_gpc() is deprecated in /home3/reasonan/public_html/wp-includes/formatting.php on line 4371
Deprecated: Function get_magic_quotes_gpc() is deprecated in /home3/reasonan/public_html/wp-includes/formatting.php on line 4371
Deprecated: Function get_magic_quotes_gpc() is deprecated in /home3/reasonan/public_html/wp-includes/formatting.php on line 4371
Deprecated: Function get_magic_quotes_gpc() is deprecated in /home3/reasonan/public_html/wp-includes/formatting.php on line 4371
Deprecated: Function get_magic_quotes_gpc() is deprecated in /home3/reasonan/public_html/wp-includes/formatting.php on line 4371
Deprecated: Function get_magic_quotes_gpc() is deprecated in /home3/reasonan/public_html/wp-includes/formatting.php on line 4371
Deprecated: Function get_magic_quotes_gpc() is deprecated in /home3/reasonan/public_html/wp-includes/formatting.php on line 4371
Deprecated: Function get_magic_quotes_gpc() is deprecated in /home3/reasonan/public_html/wp-includes/formatting.php on line 4371
Deprecated: Function get_magic_quotes_gpc() is deprecated in /home3/reasonan/public_html/wp-includes/formatting.php on line 4371
Deprecated: Function get_magic_quotes_gpc() is deprecated in /home3/reasonan/public_html/wp-includes/formatting.php on line 4371
Deprecated: Function get_magic_quotes_gpc() is deprecated in /home3/reasonan/public_html/wp-includes/formatting.php on line 4371
Deprecated: Function get_magic_quotes_gpc() is deprecated in /home3/reasonan/public_html/wp-includes/formatting.php on line 4371
Deprecated: Function get_magic_quotes_gpc() is deprecated in /home3/reasonan/public_html/wp-includes/formatting.php on line 4371
Deprecated: Function get_magic_quotes_gpc() is deprecated in /home3/reasonan/public_html/wp-includes/formatting.php on line 4371
Deprecated: Function get_magic_quotes_gpc() is deprecated in /home3/reasonan/public_html/wp-includes/formatting.php on line 4371
Deprecated: Function get_magic_quotes_gpc() is deprecated in /home3/reasonan/public_html/wp-includes/formatting.php on line 4371
I started by having students fire up Desmos, working in a 2:1 arrangement (two students per screen). While they got that ready to go, I distributed a stack of printer paper to each table. I’ll cut right to the chase here, since the directions are included in the graph:

I find that adding a folder called “Directions” is like waving a big red flag and shouting, “Do NOT read this!” My favorite direct approach is, “Read this first.”
(My favorite reverse-psychology tactic is to put the directions inside a folder at the top titled “Top Secret!” The “success” rate for students opening up such a folder is pretty fantastic. Or depressing. I suppose it depends on your perspective.)
At any rate, here are a few screens from the exploration:


Interested in tinkering a bit on your own? You can access the exploration sandbox here:
Post Script
Why the 5 in bit.ly/polar-5, you ask? Because it took me five tries to get it right. 
You Might Also Enjoy…
Here’s something I stumbled across on the Twitter after creating the exploration described above. (Thanks to Desmos for the tap on the shoulder.) Lots to love in David’s approach. Check it out for yourself:
]]>Had my Ss explore Polar Equations using @desmos and then post what they learned on a padlet. http://t.co/5vm4WkxOJl #mathchat
— David Sladkey (@dsladkey) April 14, 2015
Deprecated: Function get_magic_quotes_gpc() is deprecated in /home3/reasonan/public_html/wp-includes/formatting.php on line 4371
Deprecated: Function get_magic_quotes_gpc() is deprecated in /home3/reasonan/public_html/wp-includes/formatting.php on line 4371
Deprecated: Function get_magic_quotes_gpc() is deprecated in /home3/reasonan/public_html/wp-includes/formatting.php on line 4371
Warning: count(): Parameter must be an array or an object that implements Countable in /home3/reasonan/public_html/wp-includes/media.php on line 1206
Deprecated: Function get_magic_quotes_gpc() is deprecated in /home3/reasonan/public_html/wp-includes/formatting.php on line 4371
Deprecated: Function get_magic_quotes_gpc() is deprecated in /home3/reasonan/public_html/wp-includes/formatting.php on line 4371
Deprecated: Function get_magic_quotes_gpc() is deprecated in /home3/reasonan/public_html/wp-includes/formatting.php on line 4371
Deprecated: Function get_magic_quotes_gpc() is deprecated in /home3/reasonan/public_html/wp-includes/formatting.php on line 4371
Deprecated: Function get_magic_quotes_gpc() is deprecated in /home3/reasonan/public_html/wp-includes/formatting.php on line 4371
Deprecated: Function get_magic_quotes_gpc() is deprecated in /home3/reasonan/public_html/wp-includes/formatting.php on line 4371
Warning: count(): Parameter must be an array or an object that implements Countable in /home3/reasonan/public_html/wp-includes/media.php on line 1206
Deprecated: Function get_magic_quotes_gpc() is deprecated in /home3/reasonan/public_html/wp-includes/formatting.php on line 2432
Deprecated: Function get_magic_quotes_gpc() is deprecated in /home3/reasonan/public_html/wp-includes/formatting.php on line 4371
Deprecated: Function get_magic_quotes_gpc() is deprecated in /home3/reasonan/public_html/wp-includes/formatting.php on line 4371
Deprecated: Function get_magic_quotes_gpc() is deprecated in /home3/reasonan/public_html/wp-includes/formatting.php on line 4371
Deprecated: Function get_magic_quotes_gpc() is deprecated in /home3/reasonan/public_html/wp-includes/formatting.php on line 4371
Deprecated: Function get_magic_quotes_gpc() is deprecated in /home3/reasonan/public_html/wp-includes/formatting.php on line 4371
Deprecated: Function get_magic_quotes_gpc() is deprecated in /home3/reasonan/public_html/wp-includes/formatting.php on line 4371
Deprecated: Function get_magic_quotes_gpc() is deprecated in /home3/reasonan/public_html/wp-includes/formatting.php on line 4371
Deprecated: Function get_magic_quotes_gpc() is deprecated in /home3/reasonan/public_html/wp-includes/formatting.php on line 4371
Deprecated: Function get_magic_quotes_gpc() is deprecated in /home3/reasonan/public_html/wp-includes/formatting.php on line 4371
Deprecated: Function get_magic_quotes_gpc() is deprecated in /home3/reasonan/public_html/wp-includes/formatting.php on line 4371
Deprecated: Function get_magic_quotes_gpc() is deprecated in /home3/reasonan/public_html/wp-includes/formatting.php on line 4371
Deprecated: Function get_magic_quotes_gpc() is deprecated in /home3/reasonan/public_html/wp-includes/formatting.php on line 4371
Deprecated: Function get_magic_quotes_gpc() is deprecated in /home3/reasonan/public_html/wp-includes/formatting.php on line 4371
Deprecated: Function get_magic_quotes_gpc() is deprecated in /home3/reasonan/public_html/wp-includes/formatting.php on line 4371
Deprecated: Function get_magic_quotes_gpc() is deprecated in /home3/reasonan/public_html/wp-includes/formatting.php on line 4371
Deprecated: Function get_magic_quotes_gpc() is deprecated in /home3/reasonan/public_html/wp-includes/formatting.php on line 4371
My polar graphing unit in Precalculus has always started in the same lackluster way: With me telling students how to graph polar coordinates. We then launch into some point-by-point graphing, followed by various explorations and challenges involving graphing polar equations, and we’re off to the races. This year I wanted to try something different. Instead of telling students how to plot polar coordinates, ... ]]>
Deprecated: Function get_magic_quotes_gpc() is deprecated in /home3/reasonan/public_html/wp-includes/formatting.php on line 4371
Deprecated: Function get_magic_quotes_gpc() is deprecated in /home3/reasonan/public_html/wp-includes/formatting.php on line 4371
Deprecated: Function get_magic_quotes_gpc() is deprecated in /home3/reasonan/public_html/wp-includes/formatting.php on line 4371
Deprecated: Function get_magic_quotes_gpc() is deprecated in /home3/reasonan/public_html/wp-includes/formatting.php on line 4371
Warning: count(): Parameter must be an array or an object that implements Countable in /home3/reasonan/public_html/wp-includes/media.php on line 1206
Deprecated: Function get_magic_quotes_gpc() is deprecated in /home3/reasonan/public_html/wp-includes/formatting.php on line 4371
Deprecated: Function get_magic_quotes_gpc() is deprecated in /home3/reasonan/public_html/wp-includes/formatting.php on line 4371
Deprecated: Function get_magic_quotes_gpc() is deprecated in /home3/reasonan/public_html/wp-includes/formatting.php on line 4371
Deprecated: Function get_magic_quotes_gpc() is deprecated in /home3/reasonan/public_html/wp-includes/formatting.php on line 4371
Deprecated: Function get_magic_quotes_gpc() is deprecated in /home3/reasonan/public_html/wp-includes/formatting.php on line 4371
Deprecated: Function get_magic_quotes_gpc() is deprecated in /home3/reasonan/public_html/wp-includes/formatting.php on line 4371
Warning: count(): Parameter must be an array or an object that implements Countable in /home3/reasonan/public_html/wp-includes/media.php on line 1206
Deprecated: Function get_magic_quotes_gpc() is deprecated in /home3/reasonan/public_html/wp-includes/formatting.php on line 2432
Deprecated: Function get_magic_quotes_gpc() is deprecated in /home3/reasonan/public_html/wp-includes/formatting.php on line 4371
Deprecated: Function get_magic_quotes_gpc() is deprecated in /home3/reasonan/public_html/wp-includes/formatting.php on line 4371
Deprecated: Function get_magic_quotes_gpc() is deprecated in /home3/reasonan/public_html/wp-includes/formatting.php on line 4371
Deprecated: Function get_magic_quotes_gpc() is deprecated in /home3/reasonan/public_html/wp-includes/formatting.php on line 4371
Deprecated: Function get_magic_quotes_gpc() is deprecated in /home3/reasonan/public_html/wp-includes/formatting.php on line 4371
Deprecated: Function get_magic_quotes_gpc() is deprecated in /home3/reasonan/public_html/wp-includes/formatting.php on line 4371
Deprecated: Function get_magic_quotes_gpc() is deprecated in /home3/reasonan/public_html/wp-includes/formatting.php on line 4371
Deprecated: Function get_magic_quotes_gpc() is deprecated in /home3/reasonan/public_html/wp-includes/formatting.php on line 4371
Deprecated: Function get_magic_quotes_gpc() is deprecated in /home3/reasonan/public_html/wp-includes/formatting.php on line 4371
Deprecated: Function get_magic_quotes_gpc() is deprecated in /home3/reasonan/public_html/wp-includes/formatting.php on line 4371
Deprecated: Function get_magic_quotes_gpc() is deprecated in /home3/reasonan/public_html/wp-includes/formatting.php on line 4371
Deprecated: Function get_magic_quotes_gpc() is deprecated in /home3/reasonan/public_html/wp-includes/formatting.php on line 4371
Deprecated: Function get_magic_quotes_gpc() is deprecated in /home3/reasonan/public_html/wp-includes/formatting.php on line 4371
Deprecated: Function get_magic_quotes_gpc() is deprecated in /home3/reasonan/public_html/wp-includes/formatting.php on line 4371
Deprecated: Function get_magic_quotes_gpc() is deprecated in /home3/reasonan/public_html/wp-includes/formatting.php on line 4371
Deprecated: Function get_magic_quotes_gpc() is deprecated in /home3/reasonan/public_html/wp-includes/formatting.php on line 4371
This year I wanted to try something different. Instead of telling students how to plot polar coordinates, I wanted them to discover the mechanics by using technology to plot a handful of points.
It wasn’t exactly profound, but this brief introductory lesson felt like an improvement. I started by displaying these images:


We then fired up Desmos, with students working in pairs. Once everyone successfully plotted the first point, I turned them loose on this:
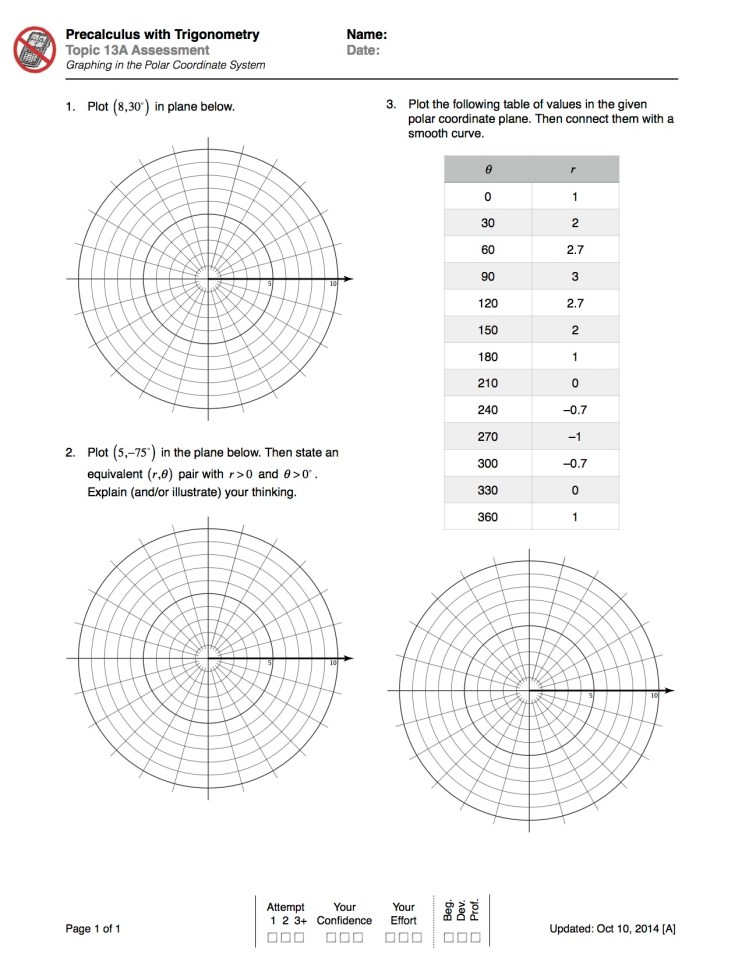
That’s my “can you plot points in the polar coordinate plane” assessment from last year. I don’t allow students to use a calculator on it, at least not when it’s a real assessment. As a learning tool, especially without the usual direct instruction intro, this page paired nicely with a bit of technology.
Debriefing
My favorite part from this brief lesson came at the end when we discussed what to do with negative radii and/or negative angles. In the past, it was a lot of “do this” and “do that” and “don’t forget this.” Here, I invited students to share their observations and make conjectures about points involving negative values.
And the payoff was in what happened next: Instead of “yes, that’s right” or “nope, try again” from me as the expert, we turned back to Desmos to test (and in most cases refine) our conjectures. While there’s still some learning to be done here, I think we’re got off to a decent start.
Looking Ahead
Next up, in reality: A Desmos-driven, noticing-and-wondering exploration with six types of polar equations. If all goes according to plan, I’ll blog about it soon.
Next up, in my ideal world: In the future, I’d prefer to squeeze an extra lesson in prior to the aforementioned/upcoming exploration. This in-between lesson would involve each student receiving an equation, finding its value every 10 degrees (from 0 to 360), and plotting those points by hand on a polar grid. I think this would serve as a nice link between the “hey, now I can graph polar points!” lesson described above, and the “oh, sweet! Desmos can graph these equations in milliseconds” exploration that follows. Maybe next time…
]]>Deprecated: Function get_magic_quotes_gpc() is deprecated in /home3/reasonan/public_html/wp-includes/formatting.php on line 4371
Deprecated: Function get_magic_quotes_gpc() is deprecated in /home3/reasonan/public_html/wp-includes/formatting.php on line 4371
Warning: count(): Parameter must be an array or an object that implements Countable in /home3/reasonan/public_html/wp-includes/media.php on line 1206
Deprecated: Function get_magic_quotes_gpc() is deprecated in /home3/reasonan/public_html/wp-includes/formatting.php on line 4371
Deprecated: Function get_magic_quotes_gpc() is deprecated in /home3/reasonan/public_html/wp-includes/formatting.php on line 4371
Deprecated: Function get_magic_quotes_gpc() is deprecated in /home3/reasonan/public_html/wp-includes/formatting.php on line 4371
Deprecated: Function get_magic_quotes_gpc() is deprecated in /home3/reasonan/public_html/wp-includes/formatting.php on line 4371
Warning: count(): Parameter must be an array or an object that implements Countable in /home3/reasonan/public_html/wp-includes/media.php on line 1206
Deprecated: Function get_magic_quotes_gpc() is deprecated in /home3/reasonan/public_html/wp-includes/formatting.php on line 4371
Deprecated: Function get_magic_quotes_gpc() is deprecated in /home3/reasonan/public_html/wp-includes/formatting.php on line 4371
Deprecated: Function get_magic_quotes_gpc() is deprecated in /home3/reasonan/public_html/wp-includes/formatting.php on line 4371
Deprecated: Function get_magic_quotes_gpc() is deprecated in /home3/reasonan/public_html/wp-includes/formatting.php on line 4371
Warning: count(): Parameter must be an array or an object that implements Countable in /home3/reasonan/public_html/wp-includes/media.php on line 1206
Deprecated: Function get_magic_quotes_gpc() is deprecated in /home3/reasonan/public_html/wp-includes/formatting.php on line 4371
Deprecated: Function get_magic_quotes_gpc() is deprecated in /home3/reasonan/public_html/wp-includes/formatting.php on line 4371
Deprecated: Function get_magic_quotes_gpc() is deprecated in /home3/reasonan/public_html/wp-includes/formatting.php on line 4371
Warning: count(): Parameter must be an array or an object that implements Countable in /home3/reasonan/public_html/wp-includes/media.php on line 1206
Deprecated: Function get_magic_quotes_gpc() is deprecated in /home3/reasonan/public_html/wp-includes/formatting.php on line 2432
Deprecated: Function get_magic_quotes_gpc() is deprecated in /home3/reasonan/public_html/wp-includes/formatting.php on line 4371
Deprecated: Function get_magic_quotes_gpc() is deprecated in /home3/reasonan/public_html/wp-includes/formatting.php on line 4371
Deprecated: Function get_magic_quotes_gpc() is deprecated in /home3/reasonan/public_html/wp-includes/formatting.php on line 4371
Deprecated: Function get_magic_quotes_gpc() is deprecated in /home3/reasonan/public_html/wp-includes/formatting.php on line 4371
Deprecated: Function get_magic_quotes_gpc() is deprecated in /home3/reasonan/public_html/wp-includes/formatting.php on line 4371
Deprecated: Function get_magic_quotes_gpc() is deprecated in /home3/reasonan/public_html/wp-includes/formatting.php on line 4371
Deprecated: Function get_magic_quotes_gpc() is deprecated in /home3/reasonan/public_html/wp-includes/formatting.php on line 4371
Deprecated: Function get_magic_quotes_gpc() is deprecated in /home3/reasonan/public_html/wp-includes/formatting.php on line 4371
Deprecated: Function get_magic_quotes_gpc() is deprecated in /home3/reasonan/public_html/wp-includes/formatting.php on line 4371
Deprecated: Function get_magic_quotes_gpc() is deprecated in /home3/reasonan/public_html/wp-includes/formatting.php on line 4371
Deprecated: Function get_magic_quotes_gpc() is deprecated in /home3/reasonan/public_html/wp-includes/formatting.php on line 4371
Deprecated: Function get_magic_quotes_gpc() is deprecated in /home3/reasonan/public_html/wp-includes/formatting.php on line 4371
Deprecated: Function get_magic_quotes_gpc() is deprecated in /home3/reasonan/public_html/wp-includes/formatting.php on line 4371
Deprecated: Function get_magic_quotes_gpc() is deprecated in /home3/reasonan/public_html/wp-includes/formatting.php on line 4371
Deprecated: Function get_magic_quotes_gpc() is deprecated in /home3/reasonan/public_html/wp-includes/formatting.php on line 4371
Deprecated: Function get_magic_quotes_gpc() is deprecated in /home3/reasonan/public_html/wp-includes/formatting.php on line 4371
Deprecated: Function get_magic_quotes_gpc() is deprecated in /home3/reasonan/public_html/wp-includes/formatting.php on line 4371
Deprecated: Function get_magic_quotes_gpc() is deprecated in /home3/reasonan/public_html/wp-includes/formatting.php on line 4371
Deprecated: Function get_magic_quotes_gpc() is deprecated in /home3/reasonan/public_html/wp-includes/formatting.php on line 4371
Deprecated: Function get_magic_quotes_gpc() is deprecated in /home3/reasonan/public_html/wp-includes/formatting.php on line 4371
Deprecated: Function get_magic_quotes_gpc() is deprecated in /home3/reasonan/public_html/wp-includes/formatting.php on line 4371
Deprecated: Function get_magic_quotes_gpc() is deprecated in /home3/reasonan/public_html/wp-includes/formatting.php on line 4371
Deprecated: Function get_magic_quotes_gpc() is deprecated in /home3/reasonan/public_html/wp-includes/formatting.php on line 4371
Deprecated: Function get_magic_quotes_gpc() is deprecated in /home3/reasonan/public_html/wp-includes/formatting.php on line 4371
Deprecated: Function get_magic_quotes_gpc() is deprecated in /home3/reasonan/public_html/wp-includes/formatting.php on line 4371
Deprecated: Function get_magic_quotes_gpc() is deprecated in /home3/reasonan/public_html/wp-includes/formatting.php on line 4371
Deprecated: Function get_magic_quotes_gpc() is deprecated in /home3/reasonan/public_html/wp-includes/formatting.php on line 4371
Deprecated: Function get_magic_quotes_gpc() is deprecated in /home3/reasonan/public_html/wp-includes/formatting.php on line 4371
Deprecated: Function get_magic_quotes_gpc() is deprecated in /home3/reasonan/public_html/wp-includes/formatting.php on line 4371
Deprecated: Function get_magic_quotes_gpc() is deprecated in /home3/reasonan/public_html/wp-includes/formatting.php on line 4371
Deprecated: Function get_magic_quotes_gpc() is deprecated in /home3/reasonan/public_html/wp-includes/formatting.php on line 4371
Deprecated: Function get_magic_quotes_gpc() is deprecated in /home3/reasonan/public_html/wp-includes/formatting.php on line 4371
Deprecated: Function get_magic_quotes_gpc() is deprecated in /home3/reasonan/public_html/wp-includes/formatting.php on line 4371
Deprecated: Function get_magic_quotes_gpc() is deprecated in /home3/reasonan/public_html/wp-includes/formatting.php on line 4371
Deprecated: Function get_magic_quotes_gpc() is deprecated in /home3/reasonan/public_html/wp-includes/formatting.php on line 4371
Deprecated: Function get_magic_quotes_gpc() is deprecated in /home3/reasonan/public_html/wp-includes/formatting.php on line 4371
Last month I shared Match My Line and Match My Parabola, a pair of Desmos-driven challenges (rather, sets of challenges). They’ve quickly become two of my favorite ways to build or deepen graphical understanding, whether working with middle school students or older kids (who “should know this stuff” but commonly do not). I brought a do-it-yourself extension of the “Match My Line” challenges to Math B a couple ... ]]>
Deprecated: Function get_magic_quotes_gpc() is deprecated in /home3/reasonan/public_html/wp-includes/formatting.php on line 4371
Deprecated: Function get_magic_quotes_gpc() is deprecated in /home3/reasonan/public_html/wp-includes/formatting.php on line 4371
Deprecated: Function get_magic_quotes_gpc() is deprecated in /home3/reasonan/public_html/wp-includes/formatting.php on line 4371
Warning: count(): Parameter must be an array or an object that implements Countable in /home3/reasonan/public_html/wp-includes/media.php on line 1206
Deprecated: Function get_magic_quotes_gpc() is deprecated in /home3/reasonan/public_html/wp-includes/formatting.php on line 4371
Deprecated: Function get_magic_quotes_gpc() is deprecated in /home3/reasonan/public_html/wp-includes/formatting.php on line 4371
Deprecated: Function get_magic_quotes_gpc() is deprecated in /home3/reasonan/public_html/wp-includes/formatting.php on line 4371
Deprecated: Function get_magic_quotes_gpc() is deprecated in /home3/reasonan/public_html/wp-includes/formatting.php on line 4371
Warning: count(): Parameter must be an array or an object that implements Countable in /home3/reasonan/public_html/wp-includes/media.php on line 1206
Deprecated: Function get_magic_quotes_gpc() is deprecated in /home3/reasonan/public_html/wp-includes/formatting.php on line 4371
Deprecated: Function get_magic_quotes_gpc() is deprecated in /home3/reasonan/public_html/wp-includes/formatting.php on line 4371
Deprecated: Function get_magic_quotes_gpc() is deprecated in /home3/reasonan/public_html/wp-includes/formatting.php on line 4371
Deprecated: Function get_magic_quotes_gpc() is deprecated in /home3/reasonan/public_html/wp-includes/formatting.php on line 4371
Warning: count(): Parameter must be an array or an object that implements Countable in /home3/reasonan/public_html/wp-includes/media.php on line 1206
Deprecated: Function get_magic_quotes_gpc() is deprecated in /home3/reasonan/public_html/wp-includes/formatting.php on line 4371
Deprecated: Function get_magic_quotes_gpc() is deprecated in /home3/reasonan/public_html/wp-includes/formatting.php on line 4371
Deprecated: Function get_magic_quotes_gpc() is deprecated in /home3/reasonan/public_html/wp-includes/formatting.php on line 4371
Warning: count(): Parameter must be an array or an object that implements Countable in /home3/reasonan/public_html/wp-includes/media.php on line 1206
Deprecated: Function get_magic_quotes_gpc() is deprecated in /home3/reasonan/public_html/wp-includes/formatting.php on line 2432
Deprecated: Function get_magic_quotes_gpc() is deprecated in /home3/reasonan/public_html/wp-includes/formatting.php on line 4371
Deprecated: Function get_magic_quotes_gpc() is deprecated in /home3/reasonan/public_html/wp-includes/formatting.php on line 4371
Deprecated: Function get_magic_quotes_gpc() is deprecated in /home3/reasonan/public_html/wp-includes/formatting.php on line 4371
Deprecated: Function get_magic_quotes_gpc() is deprecated in /home3/reasonan/public_html/wp-includes/formatting.php on line 4371
Deprecated: Function get_magic_quotes_gpc() is deprecated in /home3/reasonan/public_html/wp-includes/formatting.php on line 4371
Deprecated: Function get_magic_quotes_gpc() is deprecated in /home3/reasonan/public_html/wp-includes/formatting.php on line 4371
Deprecated: Function get_magic_quotes_gpc() is deprecated in /home3/reasonan/public_html/wp-includes/formatting.php on line 4371
Deprecated: Function get_magic_quotes_gpc() is deprecated in /home3/reasonan/public_html/wp-includes/formatting.php on line 4371
Deprecated: Function get_magic_quotes_gpc() is deprecated in /home3/reasonan/public_html/wp-includes/formatting.php on line 4371
Deprecated: Function get_magic_quotes_gpc() is deprecated in /home3/reasonan/public_html/wp-includes/formatting.php on line 4371
Deprecated: Function get_magic_quotes_gpc() is deprecated in /home3/reasonan/public_html/wp-includes/formatting.php on line 4371
Deprecated: Function get_magic_quotes_gpc() is deprecated in /home3/reasonan/public_html/wp-includes/formatting.php on line 4371
Deprecated: Function get_magic_quotes_gpc() is deprecated in /home3/reasonan/public_html/wp-includes/formatting.php on line 4371
Deprecated: Function get_magic_quotes_gpc() is deprecated in /home3/reasonan/public_html/wp-includes/formatting.php on line 4371
Deprecated: Function get_magic_quotes_gpc() is deprecated in /home3/reasonan/public_html/wp-includes/formatting.php on line 4371
Deprecated: Function get_magic_quotes_gpc() is deprecated in /home3/reasonan/public_html/wp-includes/formatting.php on line 4371
Deprecated: Function get_magic_quotes_gpc() is deprecated in /home3/reasonan/public_html/wp-includes/formatting.php on line 4371
Deprecated: Function get_magic_quotes_gpc() is deprecated in /home3/reasonan/public_html/wp-includes/formatting.php on line 4371
Deprecated: Function get_magic_quotes_gpc() is deprecated in /home3/reasonan/public_html/wp-includes/formatting.php on line 4371
Deprecated: Function get_magic_quotes_gpc() is deprecated in /home3/reasonan/public_html/wp-includes/formatting.php on line 4371
Deprecated: Function get_magic_quotes_gpc() is deprecated in /home3/reasonan/public_html/wp-includes/formatting.php on line 4371
Deprecated: Function get_magic_quotes_gpc() is deprecated in /home3/reasonan/public_html/wp-includes/formatting.php on line 4371
Deprecated: Function get_magic_quotes_gpc() is deprecated in /home3/reasonan/public_html/wp-includes/formatting.php on line 4371
Deprecated: Function get_magic_quotes_gpc() is deprecated in /home3/reasonan/public_html/wp-includes/formatting.php on line 4371
Deprecated: Function get_magic_quotes_gpc() is deprecated in /home3/reasonan/public_html/wp-includes/formatting.php on line 4371
Deprecated: Function get_magic_quotes_gpc() is deprecated in /home3/reasonan/public_html/wp-includes/formatting.php on line 4371
Deprecated: Function get_magic_quotes_gpc() is deprecated in /home3/reasonan/public_html/wp-includes/formatting.php on line 4371
Deprecated: Function get_magic_quotes_gpc() is deprecated in /home3/reasonan/public_html/wp-includes/formatting.php on line 4371
Deprecated: Function get_magic_quotes_gpc() is deprecated in /home3/reasonan/public_html/wp-includes/formatting.php on line 4371
Deprecated: Function get_magic_quotes_gpc() is deprecated in /home3/reasonan/public_html/wp-includes/formatting.php on line 4371
Deprecated: Function get_magic_quotes_gpc() is deprecated in /home3/reasonan/public_html/wp-includes/formatting.php on line 4371
Deprecated: Function get_magic_quotes_gpc() is deprecated in /home3/reasonan/public_html/wp-includes/formatting.php on line 4371
Deprecated: Function get_magic_quotes_gpc() is deprecated in /home3/reasonan/public_html/wp-includes/formatting.php on line 4371
Deprecated: Function get_magic_quotes_gpc() is deprecated in /home3/reasonan/public_html/wp-includes/formatting.php on line 4371
Deprecated: Function get_magic_quotes_gpc() is deprecated in /home3/reasonan/public_html/wp-includes/formatting.php on line 4371
Deprecated: Function get_magic_quotes_gpc() is deprecated in /home3/reasonan/public_html/wp-includes/formatting.php on line 4371

They’ve quickly become two of my favorite ways to build or deepen graphical understanding, whether working with middle school students or older kids (who “should know this stuff” but commonly do not).
I brought a do-it-yourself extension of the “Match My Line” challenges to Math B a couple weeks ago.
It. Was. Awesome.
How To Play
Step 1: Everyone starts out flying solo. Fire up Desmos. Add a pair of points. For this first-ever-instance of MMLCYO, I required one of the points to be on the y-axis (but not at the origin).

Step 2: Record the ordered pairs in the first two rows of the table. (Want the handout? Click here.)

Step 3: Find an equation that passes through the points. Confirm in Desmos.

Step 4: Trade your points (but not equation) with a partner. Hunt for their equation, using a new Desmos graph to confirm. Record the points and equation in “Their Challenge #1.”

Step 5: Find a new partner to trade with. Repeat this until you’ve filled out “Their Challenge #1-4.”
Step 6: Create a new equation, and run through four rounds of trading/graphing again, this time recording the results on the back (“Their Challenge #5-8”).
Success!
Every year since I began teaching, I’ve tried to help students develop proficiency with finding an equation to model two or more collinear points. The results have always been hit and miss. Until this year. Granted, this “Create Your Own” activity was not their first introduction to rate of change, intercepts, and slope-intercept form, but my students absolutely rocked this activity.
After the wrap up (details below), I asked students to rate their “before” and “after” understanding on a 1-5 scale (5 = high). The results were encouraging, with the typical student expressing a shift from about 2-3 to about 4-5 (with most giving an “after” rating of 5). Woohoo!
Wrap Up
I think the combination of minimal teacher talk and active students (mentally and physically) made this a success. Plus, having students confirm their results in Desmos pushed students to work on the math, rather than settling for simply “completing the page.”
We wrapped things up with four rounds of whole-class “here are my two points, what do you have to say about that” gauntlet throwing. For the first two, I took the challenge, modeling aloud the thinking I had heard around their tables throughout the class period.
For the next two challenges, I asked two students to narrate their thinking as they found the equation. They rocked it.
Looking Ahead
I plan on bringing “Match My Line • Create Your Own” back in a few weeks, but we’ll shift our attention to two non-intercept points and point-slope form.
I think this “Create Your Own” approach is also packed with potential for quadratics and other Match My Function categories, and I can’t wait to weave it into my Precalculus course later this year.
Comments?
Ideas for how to extend or improve this with lines, parabolas, or something else? Drop a line in the comments!
Student Sample #1
I snapped some scans of student handouts at the end. Here’s one:


Student Sample #2
And another:


]]>
Deprecated: Function get_magic_quotes_gpc() is deprecated in /home3/reasonan/public_html/wp-includes/formatting.php on line 4371
Warning: count(): Parameter must be an array or an object that implements Countable in /home3/reasonan/public_html/wp-includes/media.php on line 1206
Deprecated: Function get_magic_quotes_gpc() is deprecated in /home3/reasonan/public_html/wp-includes/formatting.php on line 4371
Deprecated: Function get_magic_quotes_gpc() is deprecated in /home3/reasonan/public_html/wp-includes/formatting.php on line 4371
Warning: count(): Parameter must be an array or an object that implements Countable in /home3/reasonan/public_html/wp-includes/media.php on line 1206
Deprecated: Function get_magic_quotes_gpc() is deprecated in /home3/reasonan/public_html/wp-includes/formatting.php on line 2432
Deprecated: Function get_magic_quotes_gpc() is deprecated in /home3/reasonan/public_html/wp-includes/formatting.php on line 4371
Deprecated: Function get_magic_quotes_gpc() is deprecated in /home3/reasonan/public_html/wp-includes/formatting.php on line 4371
Deprecated: Function get_magic_quotes_gpc() is deprecated in /home3/reasonan/public_html/wp-includes/formatting.php on line 4371
Deprecated: Function get_magic_quotes_gpc() is deprecated in /home3/reasonan/public_html/wp-includes/formatting.php on line 4371
Deprecated: Function get_magic_quotes_gpc() is deprecated in /home3/reasonan/public_html/wp-includes/formatting.php on line 4371
Deprecated: Function get_magic_quotes_gpc() is deprecated in /home3/reasonan/public_html/wp-includes/formatting.php on line 4371
Deprecated: Function get_magic_quotes_gpc() is deprecated in /home3/reasonan/public_html/wp-includes/formatting.php on line 4371
Deprecated: Function get_magic_quotes_gpc() is deprecated in /home3/reasonan/public_html/wp-includes/formatting.php on line 4371
Deprecated: Function get_magic_quotes_gpc() is deprecated in /home3/reasonan/public_html/wp-includes/formatting.php on line 4371
Deprecated: Function get_magic_quotes_gpc() is deprecated in /home3/reasonan/public_html/wp-includes/formatting.php on line 4371
Deprecated: Function get_magic_quotes_gpc() is deprecated in /home3/reasonan/public_html/wp-includes/formatting.php on line 4371
Deprecated: Function get_magic_quotes_gpc() is deprecated in /home3/reasonan/public_html/wp-includes/formatting.php on line 4371
As my students have worked through a series of linear graphing challenges this month, I’ve been looking for a way to challenge them to synthesize (and hopefully even extend) what they’ve noticed over the past few weeks. I think I’ve found my culminating challenge. My Goal My goal is to elicit a variety of equation styles (point-slope, slope-intercept, etc), and my hope is ... ]]>
Deprecated: Function get_magic_quotes_gpc() is deprecated in /home3/reasonan/public_html/wp-includes/formatting.php on line 4371
Deprecated: Function get_magic_quotes_gpc() is deprecated in /home3/reasonan/public_html/wp-includes/formatting.php on line 4371
Warning: count(): Parameter must be an array or an object that implements Countable in /home3/reasonan/public_html/wp-includes/media.php on line 1206
Deprecated: Function get_magic_quotes_gpc() is deprecated in /home3/reasonan/public_html/wp-includes/formatting.php on line 4371
Deprecated: Function get_magic_quotes_gpc() is deprecated in /home3/reasonan/public_html/wp-includes/formatting.php on line 4371
Warning: count(): Parameter must be an array or an object that implements Countable in /home3/reasonan/public_html/wp-includes/media.php on line 1206
Deprecated: Function get_magic_quotes_gpc() is deprecated in /home3/reasonan/public_html/wp-includes/formatting.php on line 2432
Deprecated: Function get_magic_quotes_gpc() is deprecated in /home3/reasonan/public_html/wp-includes/formatting.php on line 4371
Deprecated: Function get_magic_quotes_gpc() is deprecated in /home3/reasonan/public_html/wp-includes/formatting.php on line 4371
Deprecated: Function get_magic_quotes_gpc() is deprecated in /home3/reasonan/public_html/wp-includes/formatting.php on line 4371
Deprecated: Function get_magic_quotes_gpc() is deprecated in /home3/reasonan/public_html/wp-includes/formatting.php on line 4371
Deprecated: Function get_magic_quotes_gpc() is deprecated in /home3/reasonan/public_html/wp-includes/formatting.php on line 4371
Deprecated: Function get_magic_quotes_gpc() is deprecated in /home3/reasonan/public_html/wp-includes/formatting.php on line 4371
Deprecated: Function get_magic_quotes_gpc() is deprecated in /home3/reasonan/public_html/wp-includes/formatting.php on line 4371
Deprecated: Function get_magic_quotes_gpc() is deprecated in /home3/reasonan/public_html/wp-includes/formatting.php on line 4371
Deprecated: Function get_magic_quotes_gpc() is deprecated in /home3/reasonan/public_html/wp-includes/formatting.php on line 4371
Deprecated: Function get_magic_quotes_gpc() is deprecated in /home3/reasonan/public_html/wp-includes/formatting.php on line 4371
Deprecated: Function get_magic_quotes_gpc() is deprecated in /home3/reasonan/public_html/wp-includes/formatting.php on line 4371
Deprecated: Function get_magic_quotes_gpc() is deprecated in /home3/reasonan/public_html/wp-includes/formatting.php on line 4371
I think I’ve found my culminating challenge.


My Goal
My goal is to elicit a variety of equation styles (point-slope, slope-intercept, etc), and my hope is that the restriction (which numbers they may use in the equations) is not only clear enough, but also provides the right dose of structure to encourage students to think more deeply about the relationships between the rate of change, intercepts, non-intercept points, and the parameters in each equation.
To give it a test run before sharing it in my own class, I hereby offer you this:
Your Challenge
How many different equations can you write using only the numbers included in the ordered pairs? Can you get to three? How about five? Maybe even 10? Or more?!
Do the work in Desmos, and drop a line in the comments!
As always, feedback—on the challenge in general, or the restriction in particular—is 100% welcome.
Update
I struggled with the wording in the original challenge. As I shared above, my goal is to draw out from students a variety of equation forms, each one utilizing information revealed by a particular point or pair of points. After some back and forth on Twitter, I settled on this reframing of the task:

I’d love to know whether you think that drives more quickly and clearly to the heart of what I want students to focus on (while leaving it open enough that students will feel freedom to tinker and explore).
]]>Deprecated: Function get_magic_quotes_gpc() is deprecated in /home3/reasonan/public_html/wp-includes/formatting.php on line 4371
Warning: count(): Parameter must be an array or an object that implements Countable in /home3/reasonan/public_html/wp-includes/media.php on line 1206
Deprecated: Function get_magic_quotes_gpc() is deprecated in /home3/reasonan/public_html/wp-includes/formatting.php on line 4371
Deprecated: Function get_magic_quotes_gpc() is deprecated in /home3/reasonan/public_html/wp-includes/formatting.php on line 4371
Warning: count(): Parameter must be an array or an object that implements Countable in /home3/reasonan/public_html/wp-includes/media.php on line 1206
Deprecated: Function get_magic_quotes_gpc() is deprecated in /home3/reasonan/public_html/wp-includes/formatting.php on line 2432
Deprecated: Function get_magic_quotes_gpc() is deprecated in /home3/reasonan/public_html/wp-includes/formatting.php on line 4371
Deprecated: Function get_magic_quotes_gpc() is deprecated in /home3/reasonan/public_html/wp-includes/formatting.php on line 4371
Deprecated: Function get_magic_quotes_gpc() is deprecated in /home3/reasonan/public_html/wp-includes/formatting.php on line 4371
Deprecated: Function get_magic_quotes_gpc() is deprecated in /home3/reasonan/public_html/wp-includes/formatting.php on line 4371
Deprecated: Function get_magic_quotes_gpc() is deprecated in /home3/reasonan/public_html/wp-includes/formatting.php on line 4371
Deprecated: Function get_magic_quotes_gpc() is deprecated in /home3/reasonan/public_html/wp-includes/formatting.php on line 4371
Deprecated: Function get_magic_quotes_gpc() is deprecated in /home3/reasonan/public_html/wp-includes/formatting.php on line 4371
Deprecated: Function get_magic_quotes_gpc() is deprecated in /home3/reasonan/public_html/wp-includes/formatting.php on line 4371
I started something new this week. I’m not entirely sure where it will end up, but I like how things are shaping up after just one challenge. Here’s what I presented to my students: https://www.desmos.com/calculator/kposfnfytr Age-appropriate for Precalculus and Calculus? Not exactly. With a slight nudge, this is something a group of Desmos-equipped 6th graders could tackle. But… Oh. My. ... ]]>
Deprecated: Function get_magic_quotes_gpc() is deprecated in /home3/reasonan/public_html/wp-includes/formatting.php on line 4371
Deprecated: Function get_magic_quotes_gpc() is deprecated in /home3/reasonan/public_html/wp-includes/formatting.php on line 4371
Warning: count(): Parameter must be an array or an object that implements Countable in /home3/reasonan/public_html/wp-includes/media.php on line 1206
Deprecated: Function get_magic_quotes_gpc() is deprecated in /home3/reasonan/public_html/wp-includes/formatting.php on line 4371
Deprecated: Function get_magic_quotes_gpc() is deprecated in /home3/reasonan/public_html/wp-includes/formatting.php on line 4371
Warning: count(): Parameter must be an array or an object that implements Countable in /home3/reasonan/public_html/wp-includes/media.php on line 1206
Deprecated: Function get_magic_quotes_gpc() is deprecated in /home3/reasonan/public_html/wp-includes/formatting.php on line 2432
Deprecated: Function get_magic_quotes_gpc() is deprecated in /home3/reasonan/public_html/wp-includes/formatting.php on line 4371
Deprecated: Function get_magic_quotes_gpc() is deprecated in /home3/reasonan/public_html/wp-includes/formatting.php on line 4371
Deprecated: Function get_magic_quotes_gpc() is deprecated in /home3/reasonan/public_html/wp-includes/formatting.php on line 4371
Deprecated: Function get_magic_quotes_gpc() is deprecated in /home3/reasonan/public_html/wp-includes/formatting.php on line 4371
Deprecated: Function get_magic_quotes_gpc() is deprecated in /home3/reasonan/public_html/wp-includes/formatting.php on line 4371
Deprecated: Function get_magic_quotes_gpc() is deprecated in /home3/reasonan/public_html/wp-includes/formatting.php on line 4371
Deprecated: Function get_magic_quotes_gpc() is deprecated in /home3/reasonan/public_html/wp-includes/formatting.php on line 4371
Deprecated: Function get_magic_quotes_gpc() is deprecated in /home3/reasonan/public_html/wp-includes/formatting.php on line 4371
Here’s what I presented to my students:

https://www.desmos.com/calculator/kposfnfytr
Age-appropriate for Precalculus and Calculus? Not exactly. With a slight nudge, this is something a group of Desmos-equipped 6th graders could tackle.
But… Oh. My. The blank stares. The confused looks. The surprisingly non-isolated bewilderment.
I could write a post about how students “get rusty” with things they don’t practice, et cetera, but I think something else is going on here. Many students struggled in such a way that I suspect—rather, I’m convinced—they never learned much of anything about linear functions at any depth. (I shudder to think about how deep their understanding of exponential and logarithmic functions goes, even as we’ve been working with these functions all throughout the year.) Presented with a problem in a format just slightly askew from what they’re used to, they struggled and stalled.
I could write a blog post lamenting the quality of the students passed along to me by various colleagues. But there’s more to the story, especially since I’ve taught most of these students in two, three, four, or even five other classes. An indictment on their former teachers is an indictment on myself.
So what’s my next move? How do I address the current state of graphing affairs in my own classroom and in our department as a whole? With a few resolutions:
- Resolved, never to treat a particular mathematical topic in isolation when valuable connections are readily available.
- Resolved, to present students with tasks which demand that they make connections between numerical, graphical, and algebraic representations.
- Resolved, to allow key topics to spill over across the confines of individual lessons, chapters, and units.
- In particular… Resolved, to develop a series of “match my graph” challenges to develop students’ “function sense” (or “graphing sense”?) over the course of the entire year.
- Better yet… Resolved, to collaborate with my colleagues (in real life as well as online) to develop a series of thoughtfully sequenced/coordinated “match my graph” challenges for every course in the 7-12 sequence.
For now, I’ll create two or three challenges per week to share with my Precalculus and Calculus classes. They’ll gradually grow in difficulty, and we’ll soon shift from linear to quadratic, to power and exponential and logarithmic, to conic, to parametric, to trigonometric, and even to polar. Eventually, I hope to tag the challenges by grade level (with some challenges receiving multiple tags) so we can more easily integrate them into the rest of our courses in the department.
I’ll report back on our progress later this semester. In the meantime, if you want to create a few challenges of your own, I’d love to see them!
Postscript
In fairness to my students, some solved the challenge rather easily (as they should have). I’ll soon provide them with a more demanding challenge, but for now, I’m interested in seeing how I can address the blank stares and confused looks that popped up on more than a few faces earlier this week.
Update
I’ve added a lesson called Match My Graph: Linear Functions to the Lessons page. The lesson (actually, a series of mini-lessons) contains eight linear function challenges, including this one:

https://www.desmos.com/calculator/phmxercufm
Another Update
One of my students brought a huge smile to my face with an email this weekend. Read about it here.
]]>Deprecated: Function get_magic_quotes_gpc() is deprecated in /home3/reasonan/public_html/wp-includes/formatting.php on line 4371
Warning: count(): Parameter must be an array or an object that implements Countable in /home3/reasonan/public_html/wp-includes/media.php on line 1206
Deprecated: Function get_magic_quotes_gpc() is deprecated in /home3/reasonan/public_html/wp-includes/formatting.php on line 2432
Deprecated: Function get_magic_quotes_gpc() is deprecated in /home3/reasonan/public_html/wp-includes/formatting.php on line 4371
Deprecated: Function get_magic_quotes_gpc() is deprecated in /home3/reasonan/public_html/wp-includes/formatting.php on line 4371
Deprecated: Function get_magic_quotes_gpc() is deprecated in /home3/reasonan/public_html/wp-includes/formatting.php on line 4371
Deprecated: Function get_magic_quotes_gpc() is deprecated in /home3/reasonan/public_html/wp-includes/formatting.php on line 4371
What can you do with this? Source: http://9to5google.com/2014/06/05/googles-browsers-eclipse-microsoft-to-become-the-most-popular-in-the-u-s/]]>
Deprecated: Function get_magic_quotes_gpc() is deprecated in /home3/reasonan/public_html/wp-includes/formatting.php on line 4371
Deprecated: Function get_magic_quotes_gpc() is deprecated in /home3/reasonan/public_html/wp-includes/formatting.php on line 4371
Warning: count(): Parameter must be an array or an object that implements Countable in /home3/reasonan/public_html/wp-includes/media.php on line 1206
Deprecated: Function get_magic_quotes_gpc() is deprecated in /home3/reasonan/public_html/wp-includes/formatting.php on line 2432
Deprecated: Function get_magic_quotes_gpc() is deprecated in /home3/reasonan/public_html/wp-includes/formatting.php on line 4371
Deprecated: Function get_magic_quotes_gpc() is deprecated in /home3/reasonan/public_html/wp-includes/formatting.php on line 4371
Deprecated: Function get_magic_quotes_gpc() is deprecated in /home3/reasonan/public_html/wp-includes/formatting.php on line 4371
Deprecated: Function get_magic_quotes_gpc() is deprecated in /home3/reasonan/public_html/wp-includes/formatting.php on line 4371

Source: http://9to5google.com/2014/06/05/googles-browsers-eclipse-microsoft-to-become-the-most-popular-in-the-u-s/
]]>Deprecated: Function get_magic_quotes_gpc() is deprecated in /home3/reasonan/public_html/wp-includes/formatting.php on line 4371
Deprecated: Function get_magic_quotes_gpc() is deprecated in /home3/reasonan/public_html/wp-includes/formatting.php on line 4371
Warning: count(): Parameter must be an array or an object that implements Countable in /home3/reasonan/public_html/wp-includes/media.php on line 1206
Deprecated: Function get_magic_quotes_gpc() is deprecated in /home3/reasonan/public_html/wp-includes/formatting.php on line 4371
Deprecated: Function get_magic_quotes_gpc() is deprecated in /home3/reasonan/public_html/wp-includes/formatting.php on line 4371
Deprecated: Function get_magic_quotes_gpc() is deprecated in /home3/reasonan/public_html/wp-includes/formatting.php on line 4371
Warning: count(): Parameter must be an array or an object that implements Countable in /home3/reasonan/public_html/wp-includes/media.php on line 1206
Deprecated: Function get_magic_quotes_gpc() is deprecated in /home3/reasonan/public_html/wp-includes/formatting.php on line 2432
Deprecated: Function get_magic_quotes_gpc() is deprecated in /home3/reasonan/public_html/wp-includes/formatting.php on line 4371
Deprecated: Function get_magic_quotes_gpc() is deprecated in /home3/reasonan/public_html/wp-includes/formatting.php on line 4371
Deprecated: Function get_magic_quotes_gpc() is deprecated in /home3/reasonan/public_html/wp-includes/formatting.php on line 4371
Deprecated: Function get_magic_quotes_gpc() is deprecated in /home3/reasonan/public_html/wp-includes/formatting.php on line 4371
Deprecated: Function get_magic_quotes_gpc() is deprecated in /home3/reasonan/public_html/wp-includes/formatting.php on line 4371
Deprecated: Function get_magic_quotes_gpc() is deprecated in /home3/reasonan/public_html/wp-includes/formatting.php on line 4371
Deprecated: Function get_magic_quotes_gpc() is deprecated in /home3/reasonan/public_html/wp-includes/formatting.php on line 4371
Deprecated: Function get_magic_quotes_gpc() is deprecated in /home3/reasonan/public_html/wp-includes/formatting.php on line 4371
Deprecated: Function get_magic_quotes_gpc() is deprecated in /home3/reasonan/public_html/wp-includes/formatting.php on line 4371
Deprecated: Function get_magic_quotes_gpc() is deprecated in /home3/reasonan/public_html/wp-includes/formatting.php on line 4371
Deprecated: Function get_magic_quotes_gpc() is deprecated in /home3/reasonan/public_html/wp-includes/formatting.php on line 4371
Deprecated: Function get_magic_quotes_gpc() is deprecated in /home3/reasonan/public_html/wp-includes/formatting.php on line 4371
I created a silly little game for my Algebra 1 students several weeks ago. The motivation? Five-fold! We’re a little weak with graphing lines. Some open-ended, Desmos-driven, instant-feedback style practice may help. Domain and range? Yeah, not so much. Inequalities? Haven’t done them justice. Yet. (Growth mindset, baby!) Vertex form for quadratics? Still struggling. We tried Des-man a few days before this game ... ]]>
Deprecated: Function get_magic_quotes_gpc() is deprecated in /home3/reasonan/public_html/wp-includes/formatting.php on line 4371
Deprecated: Function get_magic_quotes_gpc() is deprecated in /home3/reasonan/public_html/wp-includes/formatting.php on line 4371
Deprecated: Function get_magic_quotes_gpc() is deprecated in /home3/reasonan/public_html/wp-includes/formatting.php on line 4371
Warning: count(): Parameter must be an array or an object that implements Countable in /home3/reasonan/public_html/wp-includes/media.php on line 1206
Deprecated: Function get_magic_quotes_gpc() is deprecated in /home3/reasonan/public_html/wp-includes/formatting.php on line 4371
Deprecated: Function get_magic_quotes_gpc() is deprecated in /home3/reasonan/public_html/wp-includes/formatting.php on line 4371
Deprecated: Function get_magic_quotes_gpc() is deprecated in /home3/reasonan/public_html/wp-includes/formatting.php on line 4371
Warning: count(): Parameter must be an array or an object that implements Countable in /home3/reasonan/public_html/wp-includes/media.php on line 1206
Deprecated: Function get_magic_quotes_gpc() is deprecated in /home3/reasonan/public_html/wp-includes/formatting.php on line 2432
Deprecated: Function get_magic_quotes_gpc() is deprecated in /home3/reasonan/public_html/wp-includes/formatting.php on line 4371
Deprecated: Function get_magic_quotes_gpc() is deprecated in /home3/reasonan/public_html/wp-includes/formatting.php on line 4371
Deprecated: Function get_magic_quotes_gpc() is deprecated in /home3/reasonan/public_html/wp-includes/formatting.php on line 4371
Deprecated: Function get_magic_quotes_gpc() is deprecated in /home3/reasonan/public_html/wp-includes/formatting.php on line 4371
Deprecated: Function get_magic_quotes_gpc() is deprecated in /home3/reasonan/public_html/wp-includes/formatting.php on line 4371
Deprecated: Function get_magic_quotes_gpc() is deprecated in /home3/reasonan/public_html/wp-includes/formatting.php on line 4371
Deprecated: Function get_magic_quotes_gpc() is deprecated in /home3/reasonan/public_html/wp-includes/formatting.php on line 4371
Deprecated: Function get_magic_quotes_gpc() is deprecated in /home3/reasonan/public_html/wp-includes/formatting.php on line 4371
Deprecated: Function get_magic_quotes_gpc() is deprecated in /home3/reasonan/public_html/wp-includes/formatting.php on line 4371
Deprecated: Function get_magic_quotes_gpc() is deprecated in /home3/reasonan/public_html/wp-includes/formatting.php on line 4371
Deprecated: Function get_magic_quotes_gpc() is deprecated in /home3/reasonan/public_html/wp-includes/formatting.php on line 4371
Deprecated: Function get_magic_quotes_gpc() is deprecated in /home3/reasonan/public_html/wp-includes/formatting.php on line 4371
- We’re a little weak with graphing lines. Some open-ended, Desmos-driven, instant-feedback style practice may help.
- Domain and range? Yeah, not so much.
- Inequalities? Haven’t done them justice. Yet. (Growth mindset, baby!)
- Vertex form for quadratics? Still struggling.
- We tried Des-man a few days before this game and found nothing but pain and frustration. Some could be attributed to me (in particular, a bungled launch of the activity), some to students’ lingering struggles (noted above), and most of the rest to the declining state of our netbook cart. (But they seemed so cool in 2009!)
At any rate, to get that bad taste out of my mouth and set the stage for greater success on the next Des-man go around, I created the Dot Capture Game. Here’s what you need:
- Students (working in pairs)
- Devices (we actually used 50% smartphones, 25% tablets, 25% laptops)
- The world’s greatest, most beautiful graphing calculator
And of course, the handout:

Getting Started
Give a brief intro—or none at all—and turn ’em loose. If your experience is anything like mine, you’ll find yourself the weaving in and out of some great (albeit trivially-inspired) conversations about slope, intercepts, point-slope form, domain, range, inequalities and shading, vertices, direction of opening, etc.
This is definitely not high-quality modeling stuff (it’s not even low-quality modeling stuff), but it proved a great way to engage students with meaningful (read: productive) practice on a variety of topics related to graphing.
Oh, and the winner in my class? Here you go:

Final Thoughts
After trying this out in Algebra 1, I thought I’d throw it at my Algebra 2 and Precalculus students to see what they would do with it. It turned out to be good practice in those settings as well. Before sharing with these followup classes, a quick tweak to the handout was in order. In my first class, several students lost their graphs and expressions after hitting a deadly combination of keys on their device, and only one or two had been keeping a shiny written record. So to protect against future heartache, I added a second page to the handout. Here’s what one of them looked like at the end of class:

Update
Here’s a sweet suggestion from Desmos:
]]>@mjfenton What if Ss rolled two dice to determine which curves they had to use and the numbers also represented the coordinate to capture?
— Desmos.com (@Desmos) May 22, 2014
Deprecated: Function get_magic_quotes_gpc() is deprecated in /home3/reasonan/public_html/wp-includes/formatting.php on line 4371
Warning: count(): Parameter must be an array or an object that implements Countable in /home3/reasonan/public_html/wp-includes/media.php on line 1206
Deprecated: Function get_magic_quotes_gpc() is deprecated in /home3/reasonan/public_html/wp-includes/formatting.php on line 4371
Deprecated: Function get_magic_quotes_gpc() is deprecated in /home3/reasonan/public_html/wp-includes/formatting.php on line 4371
Warning: count(): Parameter must be an array or an object that implements Countable in /home3/reasonan/public_html/wp-includes/media.php on line 1206
Deprecated: Function get_magic_quotes_gpc() is deprecated in /home3/reasonan/public_html/wp-includes/formatting.php on line 2432
Deprecated: Function get_magic_quotes_gpc() is deprecated in /home3/reasonan/public_html/wp-includes/formatting.php on line 4371
Deprecated: Function get_magic_quotes_gpc() is deprecated in /home3/reasonan/public_html/wp-includes/formatting.php on line 4371
Deprecated: Function get_magic_quotes_gpc() is deprecated in /home3/reasonan/public_html/wp-includes/formatting.php on line 4371
Deprecated: Function get_magic_quotes_gpc() is deprecated in /home3/reasonan/public_html/wp-includes/formatting.php on line 4371
Deprecated: Function get_magic_quotes_gpc() is deprecated in /home3/reasonan/public_html/wp-includes/formatting.php on line 4371
Deprecated: Function get_magic_quotes_gpc() is deprecated in /home3/reasonan/public_html/wp-includes/formatting.php on line 4371
Deprecated: Function get_magic_quotes_gpc() is deprecated in /home3/reasonan/public_html/wp-includes/formatting.php on line 4371
Deprecated: Function get_magic_quotes_gpc() is deprecated in /home3/reasonan/public_html/wp-includes/formatting.php on line 4371
Deprecated: Function get_magic_quotes_gpc() is deprecated in /home3/reasonan/public_html/wp-includes/formatting.php on line 4371
Deprecated: Function get_magic_quotes_gpc() is deprecated in /home3/reasonan/public_html/wp-includes/formatting.php on line 4371
Deprecated: Function get_magic_quotes_gpc() is deprecated in /home3/reasonan/public_html/wp-includes/formatting.php on line 4371
Deprecated: Function get_magic_quotes_gpc() is deprecated in /home3/reasonan/public_html/wp-includes/formatting.php on line 4371
Deprecated: Function get_magic_quotes_gpc() is deprecated in /home3/reasonan/public_html/wp-includes/formatting.php on line 4371
Deprecated: Function get_magic_quotes_gpc() is deprecated in /home3/reasonan/public_html/wp-includes/formatting.php on line 4371
Deprecated: Function get_magic_quotes_gpc() is deprecated in /home3/reasonan/public_html/wp-includes/formatting.php on line 4371
Deprecated: Function get_magic_quotes_gpc() is deprecated in /home3/reasonan/public_html/wp-includes/formatting.php on line 4371
Deprecated: Function get_magic_quotes_gpc() is deprecated in /home3/reasonan/public_html/wp-includes/formatting.php on line 4371
Deprecated: Function get_magic_quotes_gpc() is deprecated in /home3/reasonan/public_html/wp-includes/formatting.php on line 4371
Deprecated: Function get_magic_quotes_gpc() is deprecated in /home3/reasonan/public_html/wp-includes/formatting.php on line 4371
Deprecated: Function get_magic_quotes_gpc() is deprecated in /home3/reasonan/public_html/wp-includes/formatting.php on line 4371
Deprecated: Function get_magic_quotes_gpc() is deprecated in /home3/reasonan/public_html/wp-includes/formatting.php on line 4371
Deprecated: Function get_magic_quotes_gpc() is deprecated in /home3/reasonan/public_html/wp-includes/formatting.php on line 4371
Deprecated: Function get_magic_quotes_gpc() is deprecated in /home3/reasonan/public_html/wp-includes/formatting.php on line 4371
Deprecated: Function get_magic_quotes_gpc() is deprecated in /home3/reasonan/public_html/wp-includes/formatting.php on line 4371
Deprecated: Function get_magic_quotes_gpc() is deprecated in /home3/reasonan/public_html/wp-includes/formatting.php on line 4371
Deprecated: Function get_magic_quotes_gpc() is deprecated in /home3/reasonan/public_html/wp-includes/formatting.php on line 4371
Deprecated: Function get_magic_quotes_gpc() is deprecated in /home3/reasonan/public_html/wp-includes/formatting.php on line 4371
Deprecated: Function get_magic_quotes_gpc() is deprecated in /home3/reasonan/public_html/wp-includes/formatting.php on line 4371
Deprecated: Function get_magic_quotes_gpc() is deprecated in /home3/reasonan/public_html/wp-includes/formatting.php on line 4371
Deprecated: Function get_magic_quotes_gpc() is deprecated in /home3/reasonan/public_html/wp-includes/formatting.php on line 4371
Deprecated: Function get_magic_quotes_gpc() is deprecated in /home3/reasonan/public_html/wp-includes/formatting.php on line 4371
Deprecated: Function get_magic_quotes_gpc() is deprecated in /home3/reasonan/public_html/wp-includes/formatting.php on line 4371
Deprecated: Function get_magic_quotes_gpc() is deprecated in /home3/reasonan/public_html/wp-includes/formatting.php on line 4371
Deprecated: Function get_magic_quotes_gpc() is deprecated in /home3/reasonan/public_html/wp-includes/formatting.php on line 4371
Deprecated: Function get_magic_quotes_gpc() is deprecated in /home3/reasonan/public_html/wp-includes/formatting.php on line 4371
Deprecated: Function get_magic_quotes_gpc() is deprecated in /home3/reasonan/public_html/wp-includes/formatting.php on line 4371
Deprecated: Function get_magic_quotes_gpc() is deprecated in /home3/reasonan/public_html/wp-includes/formatting.php on line 4371
Deprecated: Function get_magic_quotes_gpc() is deprecated in /home3/reasonan/public_html/wp-includes/formatting.php on line 4371
Deprecated: Function get_magic_quotes_gpc() is deprecated in /home3/reasonan/public_html/wp-includes/formatting.php on line 4371
Deprecated: Function get_magic_quotes_gpc() is deprecated in /home3/reasonan/public_html/wp-includes/formatting.php on line 4371
Deprecated: Function get_magic_quotes_gpc() is deprecated in /home3/reasonan/public_html/wp-includes/formatting.php on line 4371
Deprecated: Function get_magic_quotes_gpc() is deprecated in /home3/reasonan/public_html/wp-includes/formatting.php on line 4371
Deprecated: Function get_magic_quotes_gpc() is deprecated in /home3/reasonan/public_html/wp-includes/formatting.php on line 4371
Deprecated: Function get_magic_quotes_gpc() is deprecated in /home3/reasonan/public_html/wp-includes/formatting.php on line 4371
I was typing out solutions to an Algebra 2 assessment the other day. Question 3 on the assessment asks students to solve an equation involving absolute value. I began my solution with this… …and then launched into an algebraic confirmation of that solution. Now on the one hand, throwing a Desmos-generated graph into a “detailed solutions” handout is a great move because, well, just look at it. It’s beautiful. ... ]]>
Deprecated: Function get_magic_quotes_gpc() is deprecated in /home3/reasonan/public_html/wp-includes/formatting.php on line 4371
Deprecated: Function get_magic_quotes_gpc() is deprecated in /home3/reasonan/public_html/wp-includes/formatting.php on line 4371
Warning: count(): Parameter must be an array or an object that implements Countable in /home3/reasonan/public_html/wp-includes/media.php on line 1206
Deprecated: Function get_magic_quotes_gpc() is deprecated in /home3/reasonan/public_html/wp-includes/formatting.php on line 4371
Deprecated: Function get_magic_quotes_gpc() is deprecated in /home3/reasonan/public_html/wp-includes/formatting.php on line 4371
Warning: count(): Parameter must be an array or an object that implements Countable in /home3/reasonan/public_html/wp-includes/media.php on line 1206
Deprecated: Function get_magic_quotes_gpc() is deprecated in /home3/reasonan/public_html/wp-includes/formatting.php on line 2432
Deprecated: Function get_magic_quotes_gpc() is deprecated in /home3/reasonan/public_html/wp-includes/formatting.php on line 4371
Deprecated: Function get_magic_quotes_gpc() is deprecated in /home3/reasonan/public_html/wp-includes/formatting.php on line 4371
Deprecated: Function get_magic_quotes_gpc() is deprecated in /home3/reasonan/public_html/wp-includes/formatting.php on line 4371
Deprecated: Function get_magic_quotes_gpc() is deprecated in /home3/reasonan/public_html/wp-includes/formatting.php on line 4371
Deprecated: Function get_magic_quotes_gpc() is deprecated in /home3/reasonan/public_html/wp-includes/formatting.php on line 4371
Deprecated: Function get_magic_quotes_gpc() is deprecated in /home3/reasonan/public_html/wp-includes/formatting.php on line 4371
Deprecated: Function get_magic_quotes_gpc() is deprecated in /home3/reasonan/public_html/wp-includes/formatting.php on line 4371
Deprecated: Function get_magic_quotes_gpc() is deprecated in /home3/reasonan/public_html/wp-includes/formatting.php on line 4371
Deprecated: Function get_magic_quotes_gpc() is deprecated in /home3/reasonan/public_html/wp-includes/formatting.php on line 4371
Deprecated: Function get_magic_quotes_gpc() is deprecated in /home3/reasonan/public_html/wp-includes/formatting.php on line 4371
Deprecated: Function get_magic_quotes_gpc() is deprecated in /home3/reasonan/public_html/wp-includes/formatting.php on line 4371
Deprecated: Function get_magic_quotes_gpc() is deprecated in /home3/reasonan/public_html/wp-includes/formatting.php on line 4371
Deprecated: Function get_magic_quotes_gpc() is deprecated in /home3/reasonan/public_html/wp-includes/formatting.php on line 4371
Deprecated: Function get_magic_quotes_gpc() is deprecated in /home3/reasonan/public_html/wp-includes/formatting.php on line 4371
Deprecated: Function get_magic_quotes_gpc() is deprecated in /home3/reasonan/public_html/wp-includes/formatting.php on line 4371
Deprecated: Function get_magic_quotes_gpc() is deprecated in /home3/reasonan/public_html/wp-includes/formatting.php on line 4371
Deprecated: Function get_magic_quotes_gpc() is deprecated in /home3/reasonan/public_html/wp-includes/formatting.php on line 4371
Deprecated: Function get_magic_quotes_gpc() is deprecated in /home3/reasonan/public_html/wp-includes/formatting.php on line 4371
Deprecated: Function get_magic_quotes_gpc() is deprecated in /home3/reasonan/public_html/wp-includes/formatting.php on line 4371
Deprecated: Function get_magic_quotes_gpc() is deprecated in /home3/reasonan/public_html/wp-includes/formatting.php on line 4371
Deprecated: Function get_magic_quotes_gpc() is deprecated in /home3/reasonan/public_html/wp-includes/formatting.php on line 4371
Deprecated: Function get_magic_quotes_gpc() is deprecated in /home3/reasonan/public_html/wp-includes/formatting.php on line 4371
Deprecated: Function get_magic_quotes_gpc() is deprecated in /home3/reasonan/public_html/wp-includes/formatting.php on line 4371
Deprecated: Function get_magic_quotes_gpc() is deprecated in /home3/reasonan/public_html/wp-includes/formatting.php on line 4371
Deprecated: Function get_magic_quotes_gpc() is deprecated in /home3/reasonan/public_html/wp-includes/formatting.php on line 4371
Deprecated: Function get_magic_quotes_gpc() is deprecated in /home3/reasonan/public_html/wp-includes/formatting.php on line 4371
Deprecated: Function get_magic_quotes_gpc() is deprecated in /home3/reasonan/public_html/wp-includes/formatting.php on line 4371
Deprecated: Function get_magic_quotes_gpc() is deprecated in /home3/reasonan/public_html/wp-includes/formatting.php on line 4371
Deprecated: Function get_magic_quotes_gpc() is deprecated in /home3/reasonan/public_html/wp-includes/formatting.php on line 4371
Deprecated: Function get_magic_quotes_gpc() is deprecated in /home3/reasonan/public_html/wp-includes/formatting.php on line 4371
Deprecated: Function get_magic_quotes_gpc() is deprecated in /home3/reasonan/public_html/wp-includes/formatting.php on line 4371
Deprecated: Function get_magic_quotes_gpc() is deprecated in /home3/reasonan/public_html/wp-includes/formatting.php on line 4371
Deprecated: Function get_magic_quotes_gpc() is deprecated in /home3/reasonan/public_html/wp-includes/formatting.php on line 4371
Deprecated: Function get_magic_quotes_gpc() is deprecated in /home3/reasonan/public_html/wp-includes/formatting.php on line 4371
Deprecated: Function get_magic_quotes_gpc() is deprecated in /home3/reasonan/public_html/wp-includes/formatting.php on line 4371
Deprecated: Function get_magic_quotes_gpc() is deprecated in /home3/reasonan/public_html/wp-includes/formatting.php on line 4371
Deprecated: Function get_magic_quotes_gpc() is deprecated in /home3/reasonan/public_html/wp-includes/formatting.php on line 4371
Deprecated: Function get_magic_quotes_gpc() is deprecated in /home3/reasonan/public_html/wp-includes/formatting.php on line 4371
Deprecated: Function get_magic_quotes_gpc() is deprecated in /home3/reasonan/public_html/wp-includes/formatting.php on line 4371
Deprecated: Function get_magic_quotes_gpc() is deprecated in /home3/reasonan/public_html/wp-includes/formatting.php on line 4371
Deprecated: Function get_magic_quotes_gpc() is deprecated in /home3/reasonan/public_html/wp-includes/formatting.php on line 4371
Deprecated: Function get_magic_quotes_gpc() is deprecated in /home3/reasonan/public_html/wp-includes/formatting.php on line 4371
Deprecated: Function get_magic_quotes_gpc() is deprecated in /home3/reasonan/public_html/wp-includes/formatting.php on line 4371
Deprecated: Function get_magic_quotes_gpc() is deprecated in /home3/reasonan/public_html/wp-includes/formatting.php on line 4371

…and then launched into an algebraic confirmation of that solution.
Now on the one hand, throwing a Desmos-generated graph into a “detailed solutions” handout is a great move because, well, just look at it. It’s beautiful. And hey! Multiple representations! Plus it took about 30 seconds from start to finish. No brainer, right?
Well, on the other hand, including something like that is dangerous, because when you find yourself writing the solutions to questions 6 and 7 (as I did just a few moments later), and these questions ask for a graphical display of the solution to a one-variable linear inequality… Well now you’ve tasted greatness, and you won’t settle for anything else.
There’s just one problem: Desmos doesn’t do linear inequalities in one variable.
Okay, that last sentence is actually not true. Desmos will graph linear inequalities in one variable. You just have to ask nicely. Check it out:


I imagine I’m not the only one to do this (and it would still be pretty cool if Desmos would add one-variable number line graphing functionality… Pretty please?), but I thought I’d share how to do it anyway, just in case anyone is curious (and wants to give one-variable graphing a little Desmos-love).
Here’s How
The best way to explain is to throw a few images in here and let them do the talking. Drop me a line on Twitter (@mjfenton) or in the comments if you have any questions (or tips for how to make this even easier or more awesome). Or if your name is Eli and you have a new feature to announce.
Graph 1


Graph 2


Graph 3


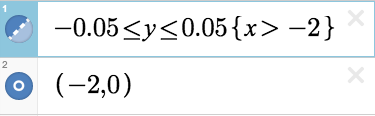
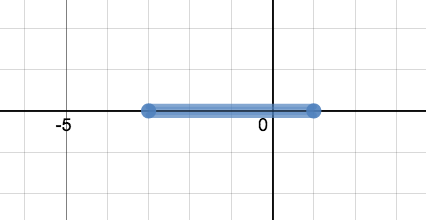
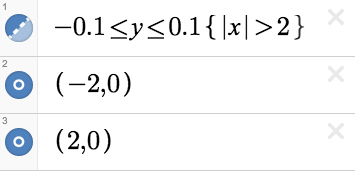