Deprecated: Function get_magic_quotes_gpc() is deprecated in /home3/reasonan/public_html/wp-includes/formatting.php on line 4371
Deprecated: Function get_magic_quotes_gpc() is deprecated in /home3/reasonan/public_html/wp-includes/formatting.php on line 4371
Deprecated: Function get_magic_quotes_gpc() is deprecated in /home3/reasonan/public_html/wp-includes/formatting.php on line 4371
Deprecated: Function get_magic_quotes_gpc() is deprecated in /home3/reasonan/public_html/wp-includes/formatting.php on line 4371
Deprecated: Function get_magic_quotes_gpc() is deprecated in /home3/reasonan/public_html/wp-includes/formatting.php on line 4371
Deprecated: Function get_magic_quotes_gpc() is deprecated in /home3/reasonan/public_html/wp-includes/formatting.php on line 4371
Warning: count(): Parameter must be an array or an object that implements Countable in /home3/reasonan/public_html/wp-includes/media.php on line 1206
Deprecated: Function get_magic_quotes_gpc() is deprecated in /home3/reasonan/public_html/wp-includes/formatting.php on line 4371
Deprecated: Function get_magic_quotes_gpc() is deprecated in /home3/reasonan/public_html/wp-includes/formatting.php on line 4371
Deprecated: Function get_magic_quotes_gpc() is deprecated in /home3/reasonan/public_html/wp-includes/formatting.php on line 4371
Deprecated: Function get_magic_quotes_gpc() is deprecated in /home3/reasonan/public_html/wp-includes/formatting.php on line 4371
Deprecated: Function get_magic_quotes_gpc() is deprecated in /home3/reasonan/public_html/wp-includes/formatting.php on line 4371
Warning: count(): Parameter must be an array or an object that implements Countable in /home3/reasonan/public_html/wp-includes/media.php on line 1206
Deprecated: Function get_magic_quotes_gpc() is deprecated in /home3/reasonan/public_html/wp-includes/formatting.php on line 2432
Deprecated: Function get_magic_quotes_gpc() is deprecated in /home3/reasonan/public_html/wp-includes/formatting.php on line 4371
Deprecated: Function get_magic_quotes_gpc() is deprecated in /home3/reasonan/public_html/wp-includes/formatting.php on line 4371
Deprecated: Function get_magic_quotes_gpc() is deprecated in /home3/reasonan/public_html/wp-includes/formatting.php on line 4371
Deprecated: Function get_magic_quotes_gpc() is deprecated in /home3/reasonan/public_html/wp-includes/formatting.php on line 4371
Deprecated: Function get_magic_quotes_gpc() is deprecated in /home3/reasonan/public_html/wp-includes/formatting.php on line 4371
Deprecated: Function get_magic_quotes_gpc() is deprecated in /home3/reasonan/public_html/wp-includes/formatting.php on line 4371
Deprecated: Function get_magic_quotes_gpc() is deprecated in /home3/reasonan/public_html/wp-includes/formatting.php on line 4371
Deprecated: Function get_magic_quotes_gpc() is deprecated in /home3/reasonan/public_html/wp-includes/formatting.php on line 4371
Deprecated: Function get_magic_quotes_gpc() is deprecated in /home3/reasonan/public_html/wp-includes/formatting.php on line 4371
After an introduction and exploration (which I wrote about here and here) to my polar graphing unit, I wanted to steer our attention in a more algebraic direction so we could establish some connections between polar and Cartesian forms. On top of that, I needed an activity that would work well with a sub. The intersection of those wants and needs? A ... ]]>
Deprecated: Function get_magic_quotes_gpc() is deprecated in /home3/reasonan/public_html/wp-includes/formatting.php on line 4371
Deprecated: Function get_magic_quotes_gpc() is deprecated in /home3/reasonan/public_html/wp-includes/formatting.php on line 4371
Deprecated: Function get_magic_quotes_gpc() is deprecated in /home3/reasonan/public_html/wp-includes/formatting.php on line 4371
Deprecated: Function get_magic_quotes_gpc() is deprecated in /home3/reasonan/public_html/wp-includes/formatting.php on line 4371
Deprecated: Function get_magic_quotes_gpc() is deprecated in /home3/reasonan/public_html/wp-includes/formatting.php on line 4371
Deprecated: Function get_magic_quotes_gpc() is deprecated in /home3/reasonan/public_html/wp-includes/formatting.php on line 4371
Warning: count(): Parameter must be an array or an object that implements Countable in /home3/reasonan/public_html/wp-includes/media.php on line 1206
Deprecated: Function get_magic_quotes_gpc() is deprecated in /home3/reasonan/public_html/wp-includes/formatting.php on line 4371
Deprecated: Function get_magic_quotes_gpc() is deprecated in /home3/reasonan/public_html/wp-includes/formatting.php on line 4371
Deprecated: Function get_magic_quotes_gpc() is deprecated in /home3/reasonan/public_html/wp-includes/formatting.php on line 4371
Deprecated: Function get_magic_quotes_gpc() is deprecated in /home3/reasonan/public_html/wp-includes/formatting.php on line 4371
Deprecated: Function get_magic_quotes_gpc() is deprecated in /home3/reasonan/public_html/wp-includes/formatting.php on line 4371
Warning: count(): Parameter must be an array or an object that implements Countable in /home3/reasonan/public_html/wp-includes/media.php on line 1206
Deprecated: Function get_magic_quotes_gpc() is deprecated in /home3/reasonan/public_html/wp-includes/formatting.php on line 2432
Deprecated: Function get_magic_quotes_gpc() is deprecated in /home3/reasonan/public_html/wp-includes/formatting.php on line 4371
Deprecated: Function get_magic_quotes_gpc() is deprecated in /home3/reasonan/public_html/wp-includes/formatting.php on line 4371
Deprecated: Function get_magic_quotes_gpc() is deprecated in /home3/reasonan/public_html/wp-includes/formatting.php on line 4371
Deprecated: Function get_magic_quotes_gpc() is deprecated in /home3/reasonan/public_html/wp-includes/formatting.php on line 4371
Deprecated: Function get_magic_quotes_gpc() is deprecated in /home3/reasonan/public_html/wp-includes/formatting.php on line 4371
Deprecated: Function get_magic_quotes_gpc() is deprecated in /home3/reasonan/public_html/wp-includes/formatting.php on line 4371
Deprecated: Function get_magic_quotes_gpc() is deprecated in /home3/reasonan/public_html/wp-includes/formatting.php on line 4371
Deprecated: Function get_magic_quotes_gpc() is deprecated in /home3/reasonan/public_html/wp-includes/formatting.php on line 4371
On top of that, I needed an activity that would work well with a sub. The intersection of those wants and needs? A sorting activity!


Print ’em out, slice ’em up, throw ’em in a Ziploc and we’re ready for action.
Students worked in small groups on the following:
- Plot the polar equations in Desmos.
- Plot the Cartesian equations in Desmos.
- Match each graph with its polar and Cartesian equations.
- Match each graph description with its cards (polar equation/Cartesian equation/graph).
I challenged students to be on the lookout for connections between the two equation forms. This is something we’ll develop further in an upcoming lesson.
But Wait, There’s More!
Sorting activities are great because they often prompt lots of discussion within the groups. However, they’re sometimes short and sweet. With that in mind, I prepared another sub-proof task for my students: A pair of equation-converting examples, followed by several practice problems. If you’re curious to see the handout, which is seriously limited in focus/scope) click here.
Looking for the sorting activity slide deck instead?
]]>Deprecated: Function get_magic_quotes_gpc() is deprecated in /home3/reasonan/public_html/wp-includes/formatting.php on line 4371
Deprecated: Function get_magic_quotes_gpc() is deprecated in /home3/reasonan/public_html/wp-includes/formatting.php on line 4371
Warning: count(): Parameter must be an array or an object that implements Countable in /home3/reasonan/public_html/wp-includes/media.php on line 1206
Deprecated: Function get_magic_quotes_gpc() is deprecated in /home3/reasonan/public_html/wp-includes/formatting.php on line 4371
Deprecated: Function get_magic_quotes_gpc() is deprecated in /home3/reasonan/public_html/wp-includes/formatting.php on line 4371
Deprecated: Function get_magic_quotes_gpc() is deprecated in /home3/reasonan/public_html/wp-includes/formatting.php on line 4371
Deprecated: Function get_magic_quotes_gpc() is deprecated in /home3/reasonan/public_html/wp-includes/formatting.php on line 4371
Deprecated: Function get_magic_quotes_gpc() is deprecated in /home3/reasonan/public_html/wp-includes/formatting.php on line 4371
Deprecated: Function get_magic_quotes_gpc() is deprecated in /home3/reasonan/public_html/wp-includes/formatting.php on line 4371
Warning: count(): Parameter must be an array or an object that implements Countable in /home3/reasonan/public_html/wp-includes/media.php on line 1206
Deprecated: Function get_magic_quotes_gpc() is deprecated in /home3/reasonan/public_html/wp-includes/formatting.php on line 2432
Deprecated: Function get_magic_quotes_gpc() is deprecated in /home3/reasonan/public_html/wp-includes/formatting.php on line 4371
Deprecated: Function get_magic_quotes_gpc() is deprecated in /home3/reasonan/public_html/wp-includes/formatting.php on line 4371
Deprecated: Function get_magic_quotes_gpc() is deprecated in /home3/reasonan/public_html/wp-includes/formatting.php on line 4371
Deprecated: Function get_magic_quotes_gpc() is deprecated in /home3/reasonan/public_html/wp-includes/formatting.php on line 4371
Deprecated: Function get_magic_quotes_gpc() is deprecated in /home3/reasonan/public_html/wp-includes/formatting.php on line 4371
Deprecated: Function get_magic_quotes_gpc() is deprecated in /home3/reasonan/public_html/wp-includes/formatting.php on line 4371
Deprecated: Function get_magic_quotes_gpc() is deprecated in /home3/reasonan/public_html/wp-includes/formatting.php on line 4371
Deprecated: Function get_magic_quotes_gpc() is deprecated in /home3/reasonan/public_html/wp-includes/formatting.php on line 4371
Deprecated: Function get_magic_quotes_gpc() is deprecated in /home3/reasonan/public_html/wp-includes/formatting.php on line 4371
Deprecated: Function get_magic_quotes_gpc() is deprecated in /home3/reasonan/public_html/wp-includes/formatting.php on line 4371
Deprecated: Function get_magic_quotes_gpc() is deprecated in /home3/reasonan/public_html/wp-includes/formatting.php on line 4371
Deprecated: Function get_magic_quotes_gpc() is deprecated in /home3/reasonan/public_html/wp-includes/formatting.php on line 4371
Deprecated: Function get_magic_quotes_gpc() is deprecated in /home3/reasonan/public_html/wp-includes/formatting.php on line 4371
Deprecated: Function get_magic_quotes_gpc() is deprecated in /home3/reasonan/public_html/wp-includes/formatting.php on line 4371
Deprecated: Function get_magic_quotes_gpc() is deprecated in /home3/reasonan/public_html/wp-includes/formatting.php on line 4371
Deprecated: Function get_magic_quotes_gpc() is deprecated in /home3/reasonan/public_html/wp-includes/formatting.php on line 4371
Deprecated: Function get_magic_quotes_gpc() is deprecated in /home3/reasonan/public_html/wp-includes/formatting.php on line 4371
Deprecated: Function get_magic_quotes_gpc() is deprecated in /home3/reasonan/public_html/wp-includes/formatting.php on line 4371
Deprecated: Function get_magic_quotes_gpc() is deprecated in /home3/reasonan/public_html/wp-includes/formatting.php on line 4371
Deprecated: Function get_magic_quotes_gpc() is deprecated in /home3/reasonan/public_html/wp-includes/formatting.php on line 4371
Deprecated: Function get_magic_quotes_gpc() is deprecated in /home3/reasonan/public_html/wp-includes/formatting.php on line 4371
Deprecated: Function get_magic_quotes_gpc() is deprecated in /home3/reasonan/public_html/wp-includes/formatting.php on line 4371
Deprecated: Function get_magic_quotes_gpc() is deprecated in /home3/reasonan/public_html/wp-includes/formatting.php on line 4371
Deprecated: Function get_magic_quotes_gpc() is deprecated in /home3/reasonan/public_html/wp-includes/formatting.php on line 4371
Deprecated: Function get_magic_quotes_gpc() is deprecated in /home3/reasonan/public_html/wp-includes/formatting.php on line 4371
Deprecated: Function get_magic_quotes_gpc() is deprecated in /home3/reasonan/public_html/wp-includes/formatting.php on line 4371
Deprecated: Function get_magic_quotes_gpc() is deprecated in /home3/reasonan/public_html/wp-includes/formatting.php on line 4371
Deprecated: Function get_magic_quotes_gpc() is deprecated in /home3/reasonan/public_html/wp-includes/formatting.php on line 4371
Over the weekend I wrote about an alternative launch to my Precalculus polar graphing unit. After that first lesson, I decided to throw out my usual “Day 2 Notes” and replaced them with a six-part, Desmos-driven exploration. I started by having students fire up Desmos, working in a 2:1 arrangement (two students per screen). While they got that ready to go, I distributed a stack ... ]]>
Deprecated: Function get_magic_quotes_gpc() is deprecated in /home3/reasonan/public_html/wp-includes/formatting.php on line 4371
Deprecated: Function get_magic_quotes_gpc() is deprecated in /home3/reasonan/public_html/wp-includes/formatting.php on line 4371
Deprecated: Function get_magic_quotes_gpc() is deprecated in /home3/reasonan/public_html/wp-includes/formatting.php on line 4371
Warning: count(): Parameter must be an array or an object that implements Countable in /home3/reasonan/public_html/wp-includes/media.php on line 1206
Deprecated: Function get_magic_quotes_gpc() is deprecated in /home3/reasonan/public_html/wp-includes/formatting.php on line 4371
Deprecated: Function get_magic_quotes_gpc() is deprecated in /home3/reasonan/public_html/wp-includes/formatting.php on line 4371
Deprecated: Function get_magic_quotes_gpc() is deprecated in /home3/reasonan/public_html/wp-includes/formatting.php on line 4371
Deprecated: Function get_magic_quotes_gpc() is deprecated in /home3/reasonan/public_html/wp-includes/formatting.php on line 4371
Deprecated: Function get_magic_quotes_gpc() is deprecated in /home3/reasonan/public_html/wp-includes/formatting.php on line 4371
Deprecated: Function get_magic_quotes_gpc() is deprecated in /home3/reasonan/public_html/wp-includes/formatting.php on line 4371
Warning: count(): Parameter must be an array or an object that implements Countable in /home3/reasonan/public_html/wp-includes/media.php on line 1206
Deprecated: Function get_magic_quotes_gpc() is deprecated in /home3/reasonan/public_html/wp-includes/formatting.php on line 2432
Deprecated: Function get_magic_quotes_gpc() is deprecated in /home3/reasonan/public_html/wp-includes/formatting.php on line 4371
Deprecated: Function get_magic_quotes_gpc() is deprecated in /home3/reasonan/public_html/wp-includes/formatting.php on line 4371
Deprecated: Function get_magic_quotes_gpc() is deprecated in /home3/reasonan/public_html/wp-includes/formatting.php on line 4371
Deprecated: Function get_magic_quotes_gpc() is deprecated in /home3/reasonan/public_html/wp-includes/formatting.php on line 4371
Deprecated: Function get_magic_quotes_gpc() is deprecated in /home3/reasonan/public_html/wp-includes/formatting.php on line 4371
Deprecated: Function get_magic_quotes_gpc() is deprecated in /home3/reasonan/public_html/wp-includes/formatting.php on line 4371
Deprecated: Function get_magic_quotes_gpc() is deprecated in /home3/reasonan/public_html/wp-includes/formatting.php on line 4371
Deprecated: Function get_magic_quotes_gpc() is deprecated in /home3/reasonan/public_html/wp-includes/formatting.php on line 4371
Deprecated: Function get_magic_quotes_gpc() is deprecated in /home3/reasonan/public_html/wp-includes/formatting.php on line 4371
Deprecated: Function get_magic_quotes_gpc() is deprecated in /home3/reasonan/public_html/wp-includes/formatting.php on line 4371
Deprecated: Function get_magic_quotes_gpc() is deprecated in /home3/reasonan/public_html/wp-includes/formatting.php on line 4371
Deprecated: Function get_magic_quotes_gpc() is deprecated in /home3/reasonan/public_html/wp-includes/formatting.php on line 4371
Deprecated: Function get_magic_quotes_gpc() is deprecated in /home3/reasonan/public_html/wp-includes/formatting.php on line 4371
Deprecated: Function get_magic_quotes_gpc() is deprecated in /home3/reasonan/public_html/wp-includes/formatting.php on line 4371
Deprecated: Function get_magic_quotes_gpc() is deprecated in /home3/reasonan/public_html/wp-includes/formatting.php on line 4371
Deprecated: Function get_magic_quotes_gpc() is deprecated in /home3/reasonan/public_html/wp-includes/formatting.php on line 4371
Deprecated: Function get_magic_quotes_gpc() is deprecated in /home3/reasonan/public_html/wp-includes/formatting.php on line 4371
Deprecated: Function get_magic_quotes_gpc() is deprecated in /home3/reasonan/public_html/wp-includes/formatting.php on line 4371
Deprecated: Function get_magic_quotes_gpc() is deprecated in /home3/reasonan/public_html/wp-includes/formatting.php on line 4371
Deprecated: Function get_magic_quotes_gpc() is deprecated in /home3/reasonan/public_html/wp-includes/formatting.php on line 4371
Deprecated: Function get_magic_quotes_gpc() is deprecated in /home3/reasonan/public_html/wp-includes/formatting.php on line 4371
Deprecated: Function get_magic_quotes_gpc() is deprecated in /home3/reasonan/public_html/wp-includes/formatting.php on line 4371
Deprecated: Function get_magic_quotes_gpc() is deprecated in /home3/reasonan/public_html/wp-includes/formatting.php on line 4371
Deprecated: Function get_magic_quotes_gpc() is deprecated in /home3/reasonan/public_html/wp-includes/formatting.php on line 4371
Deprecated: Function get_magic_quotes_gpc() is deprecated in /home3/reasonan/public_html/wp-includes/formatting.php on line 4371
Deprecated: Function get_magic_quotes_gpc() is deprecated in /home3/reasonan/public_html/wp-includes/formatting.php on line 4371
Deprecated: Function get_magic_quotes_gpc() is deprecated in /home3/reasonan/public_html/wp-includes/formatting.php on line 4371
Deprecated: Function get_magic_quotes_gpc() is deprecated in /home3/reasonan/public_html/wp-includes/formatting.php on line 4371
I started by having students fire up Desmos, working in a 2:1 arrangement (two students per screen). While they got that ready to go, I distributed a stack of printer paper to each table. I’ll cut right to the chase here, since the directions are included in the graph:

I find that adding a folder called “Directions” is like waving a big red flag and shouting, “Do NOT read this!” My favorite direct approach is, “Read this first.”
(My favorite reverse-psychology tactic is to put the directions inside a folder at the top titled “Top Secret!” The “success” rate for students opening up such a folder is pretty fantastic. Or depressing. I suppose it depends on your perspective.)
At any rate, here are a few screens from the exploration:


Interested in tinkering a bit on your own? You can access the exploration sandbox here:
Post Script
Why the 5 in bit.ly/polar-5, you ask? Because it took me five tries to get it right. 
You Might Also Enjoy…
Here’s something I stumbled across on the Twitter after creating the exploration described above. (Thanks to Desmos for the tap on the shoulder.) Lots to love in David’s approach. Check it out for yourself:
]]>Had my Ss explore Polar Equations using @desmos and then post what they learned on a padlet. http://t.co/5vm4WkxOJl #mathchat
— David Sladkey (@dsladkey) April 14, 2015
Deprecated: Function get_magic_quotes_gpc() is deprecated in /home3/reasonan/public_html/wp-includes/formatting.php on line 4371
Deprecated: Function get_magic_quotes_gpc() is deprecated in /home3/reasonan/public_html/wp-includes/formatting.php on line 4371
Deprecated: Function get_magic_quotes_gpc() is deprecated in /home3/reasonan/public_html/wp-includes/formatting.php on line 4371
Warning: count(): Parameter must be an array or an object that implements Countable in /home3/reasonan/public_html/wp-includes/media.php on line 1206
Deprecated: Function get_magic_quotes_gpc() is deprecated in /home3/reasonan/public_html/wp-includes/formatting.php on line 4371
Deprecated: Function get_magic_quotes_gpc() is deprecated in /home3/reasonan/public_html/wp-includes/formatting.php on line 4371
Deprecated: Function get_magic_quotes_gpc() is deprecated in /home3/reasonan/public_html/wp-includes/formatting.php on line 4371
Deprecated: Function get_magic_quotes_gpc() is deprecated in /home3/reasonan/public_html/wp-includes/formatting.php on line 4371
Deprecated: Function get_magic_quotes_gpc() is deprecated in /home3/reasonan/public_html/wp-includes/formatting.php on line 4371
Deprecated: Function get_magic_quotes_gpc() is deprecated in /home3/reasonan/public_html/wp-includes/formatting.php on line 4371
Warning: count(): Parameter must be an array or an object that implements Countable in /home3/reasonan/public_html/wp-includes/media.php on line 1206
Deprecated: Function get_magic_quotes_gpc() is deprecated in /home3/reasonan/public_html/wp-includes/formatting.php on line 2432
Deprecated: Function get_magic_quotes_gpc() is deprecated in /home3/reasonan/public_html/wp-includes/formatting.php on line 4371
Deprecated: Function get_magic_quotes_gpc() is deprecated in /home3/reasonan/public_html/wp-includes/formatting.php on line 4371
Deprecated: Function get_magic_quotes_gpc() is deprecated in /home3/reasonan/public_html/wp-includes/formatting.php on line 4371
Deprecated: Function get_magic_quotes_gpc() is deprecated in /home3/reasonan/public_html/wp-includes/formatting.php on line 4371
Deprecated: Function get_magic_quotes_gpc() is deprecated in /home3/reasonan/public_html/wp-includes/formatting.php on line 4371
Deprecated: Function get_magic_quotes_gpc() is deprecated in /home3/reasonan/public_html/wp-includes/formatting.php on line 4371
Deprecated: Function get_magic_quotes_gpc() is deprecated in /home3/reasonan/public_html/wp-includes/formatting.php on line 4371
Deprecated: Function get_magic_quotes_gpc() is deprecated in /home3/reasonan/public_html/wp-includes/formatting.php on line 4371
Deprecated: Function get_magic_quotes_gpc() is deprecated in /home3/reasonan/public_html/wp-includes/formatting.php on line 4371
Deprecated: Function get_magic_quotes_gpc() is deprecated in /home3/reasonan/public_html/wp-includes/formatting.php on line 4371
Deprecated: Function get_magic_quotes_gpc() is deprecated in /home3/reasonan/public_html/wp-includes/formatting.php on line 4371
Deprecated: Function get_magic_quotes_gpc() is deprecated in /home3/reasonan/public_html/wp-includes/formatting.php on line 4371
Deprecated: Function get_magic_quotes_gpc() is deprecated in /home3/reasonan/public_html/wp-includes/formatting.php on line 4371
Deprecated: Function get_magic_quotes_gpc() is deprecated in /home3/reasonan/public_html/wp-includes/formatting.php on line 4371
Deprecated: Function get_magic_quotes_gpc() is deprecated in /home3/reasonan/public_html/wp-includes/formatting.php on line 4371
Deprecated: Function get_magic_quotes_gpc() is deprecated in /home3/reasonan/public_html/wp-includes/formatting.php on line 4371
My polar graphing unit in Precalculus has always started in the same lackluster way: With me telling students how to graph polar coordinates. We then launch into some point-by-point graphing, followed by various explorations and challenges involving graphing polar equations, and we’re off to the races. This year I wanted to try something different. Instead of telling students how to plot polar coordinates, ... ]]>
Deprecated: Function get_magic_quotes_gpc() is deprecated in /home3/reasonan/public_html/wp-includes/formatting.php on line 4371
Deprecated: Function get_magic_quotes_gpc() is deprecated in /home3/reasonan/public_html/wp-includes/formatting.php on line 4371
Deprecated: Function get_magic_quotes_gpc() is deprecated in /home3/reasonan/public_html/wp-includes/formatting.php on line 4371
Deprecated: Function get_magic_quotes_gpc() is deprecated in /home3/reasonan/public_html/wp-includes/formatting.php on line 4371
Warning: count(): Parameter must be an array or an object that implements Countable in /home3/reasonan/public_html/wp-includes/media.php on line 1206
Deprecated: Function get_magic_quotes_gpc() is deprecated in /home3/reasonan/public_html/wp-includes/formatting.php on line 4371
Deprecated: Function get_magic_quotes_gpc() is deprecated in /home3/reasonan/public_html/wp-includes/formatting.php on line 4371
Deprecated: Function get_magic_quotes_gpc() is deprecated in /home3/reasonan/public_html/wp-includes/formatting.php on line 4371
Deprecated: Function get_magic_quotes_gpc() is deprecated in /home3/reasonan/public_html/wp-includes/formatting.php on line 4371
Deprecated: Function get_magic_quotes_gpc() is deprecated in /home3/reasonan/public_html/wp-includes/formatting.php on line 4371
Deprecated: Function get_magic_quotes_gpc() is deprecated in /home3/reasonan/public_html/wp-includes/formatting.php on line 4371
Warning: count(): Parameter must be an array or an object that implements Countable in /home3/reasonan/public_html/wp-includes/media.php on line 1206
Deprecated: Function get_magic_quotes_gpc() is deprecated in /home3/reasonan/public_html/wp-includes/formatting.php on line 2432
Deprecated: Function get_magic_quotes_gpc() is deprecated in /home3/reasonan/public_html/wp-includes/formatting.php on line 4371
Deprecated: Function get_magic_quotes_gpc() is deprecated in /home3/reasonan/public_html/wp-includes/formatting.php on line 4371
Deprecated: Function get_magic_quotes_gpc() is deprecated in /home3/reasonan/public_html/wp-includes/formatting.php on line 4371
Deprecated: Function get_magic_quotes_gpc() is deprecated in /home3/reasonan/public_html/wp-includes/formatting.php on line 4371
Deprecated: Function get_magic_quotes_gpc() is deprecated in /home3/reasonan/public_html/wp-includes/formatting.php on line 4371
Deprecated: Function get_magic_quotes_gpc() is deprecated in /home3/reasonan/public_html/wp-includes/formatting.php on line 4371
Deprecated: Function get_magic_quotes_gpc() is deprecated in /home3/reasonan/public_html/wp-includes/formatting.php on line 4371
Deprecated: Function get_magic_quotes_gpc() is deprecated in /home3/reasonan/public_html/wp-includes/formatting.php on line 4371
Deprecated: Function get_magic_quotes_gpc() is deprecated in /home3/reasonan/public_html/wp-includes/formatting.php on line 4371
Deprecated: Function get_magic_quotes_gpc() is deprecated in /home3/reasonan/public_html/wp-includes/formatting.php on line 4371
Deprecated: Function get_magic_quotes_gpc() is deprecated in /home3/reasonan/public_html/wp-includes/formatting.php on line 4371
Deprecated: Function get_magic_quotes_gpc() is deprecated in /home3/reasonan/public_html/wp-includes/formatting.php on line 4371
Deprecated: Function get_magic_quotes_gpc() is deprecated in /home3/reasonan/public_html/wp-includes/formatting.php on line 4371
Deprecated: Function get_magic_quotes_gpc() is deprecated in /home3/reasonan/public_html/wp-includes/formatting.php on line 4371
Deprecated: Function get_magic_quotes_gpc() is deprecated in /home3/reasonan/public_html/wp-includes/formatting.php on line 4371
Deprecated: Function get_magic_quotes_gpc() is deprecated in /home3/reasonan/public_html/wp-includes/formatting.php on line 4371
This year I wanted to try something different. Instead of telling students how to plot polar coordinates, I wanted them to discover the mechanics by using technology to plot a handful of points.
It wasn’t exactly profound, but this brief introductory lesson felt like an improvement. I started by displaying these images:


We then fired up Desmos, with students working in pairs. Once everyone successfully plotted the first point, I turned them loose on this:
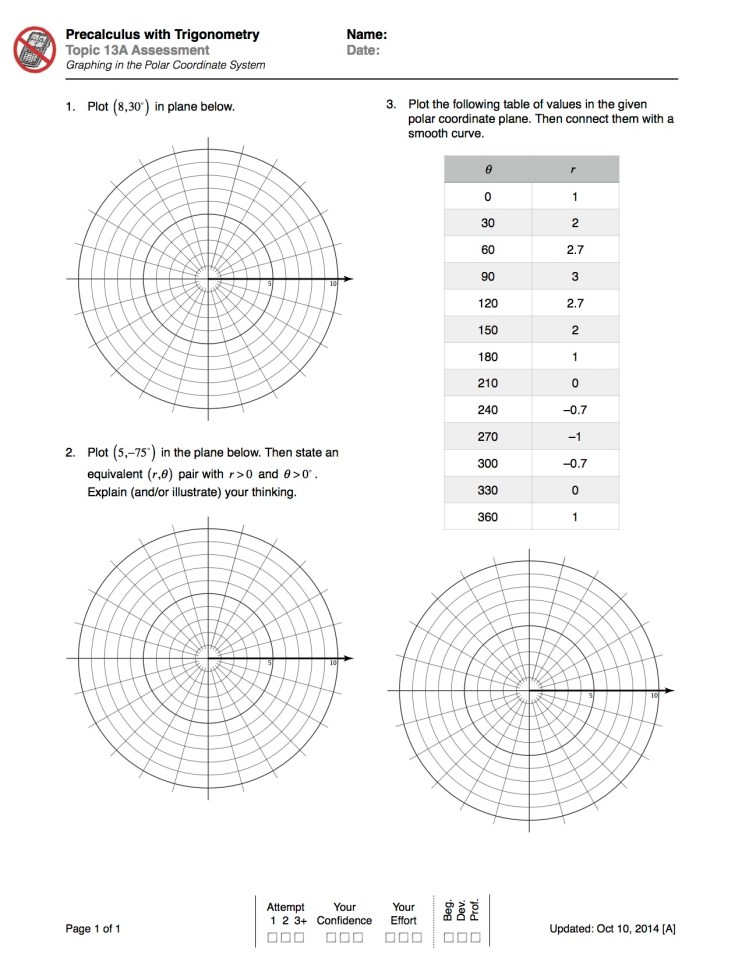
That’s my “can you plot points in the polar coordinate plane” assessment from last year. I don’t allow students to use a calculator on it, at least not when it’s a real assessment. As a learning tool, especially without the usual direct instruction intro, this page paired nicely with a bit of technology.
Debriefing
My favorite part from this brief lesson came at the end when we discussed what to do with negative radii and/or negative angles. In the past, it was a lot of “do this” and “do that” and “don’t forget this.” Here, I invited students to share their observations and make conjectures about points involving negative values.
And the payoff was in what happened next: Instead of “yes, that’s right” or “nope, try again” from me as the expert, we turned back to Desmos to test (and in most cases refine) our conjectures. While there’s still some learning to be done here, I think we’re got off to a decent start.
Looking Ahead
Next up, in reality: A Desmos-driven, noticing-and-wondering exploration with six types of polar equations. If all goes according to plan, I’ll blog about it soon.
Next up, in my ideal world: In the future, I’d prefer to squeeze an extra lesson in prior to the aforementioned/upcoming exploration. This in-between lesson would involve each student receiving an equation, finding its value every 10 degrees (from 0 to 360), and plotting those points by hand on a polar grid. I think this would serve as a nice link between the “hey, now I can graph polar points!” lesson described above, and the “oh, sweet! Desmos can graph these equations in milliseconds” exploration that follows. Maybe next time…
]]>Deprecated: Function get_magic_quotes_gpc() is deprecated in /home3/reasonan/public_html/wp-includes/formatting.php on line 4371
Warning: count(): Parameter must be an array or an object that implements Countable in /home3/reasonan/public_html/wp-includes/media.php on line 1206
Deprecated: Function get_magic_quotes_gpc() is deprecated in /home3/reasonan/public_html/wp-includes/formatting.php on line 4371
Deprecated: Function get_magic_quotes_gpc() is deprecated in /home3/reasonan/public_html/wp-includes/formatting.php on line 4371
Warning: count(): Parameter must be an array or an object that implements Countable in /home3/reasonan/public_html/wp-includes/media.php on line 1206
Deprecated: Function get_magic_quotes_gpc() is deprecated in /home3/reasonan/public_html/wp-includes/formatting.php on line 2432
Deprecated: Function get_magic_quotes_gpc() is deprecated in /home3/reasonan/public_html/wp-includes/formatting.php on line 4371
Deprecated: Function get_magic_quotes_gpc() is deprecated in /home3/reasonan/public_html/wp-includes/formatting.php on line 4371
Deprecated: Function get_magic_quotes_gpc() is deprecated in /home3/reasonan/public_html/wp-includes/formatting.php on line 4371
Deprecated: Function get_magic_quotes_gpc() is deprecated in /home3/reasonan/public_html/wp-includes/formatting.php on line 4371
Deprecated: Function get_magic_quotes_gpc() is deprecated in /home3/reasonan/public_html/wp-includes/formatting.php on line 4371
Deprecated: Function get_magic_quotes_gpc() is deprecated in /home3/reasonan/public_html/wp-includes/formatting.php on line 4371
Deprecated: Function get_magic_quotes_gpc() is deprecated in /home3/reasonan/public_html/wp-includes/formatting.php on line 4371
Deprecated: Function get_magic_quotes_gpc() is deprecated in /home3/reasonan/public_html/wp-includes/formatting.php on line 4371
Deprecated: Function get_magic_quotes_gpc() is deprecated in /home3/reasonan/public_html/wp-includes/formatting.php on line 4371
Deprecated: Function get_magic_quotes_gpc() is deprecated in /home3/reasonan/public_html/wp-includes/formatting.php on line 4371
Deprecated: Function get_magic_quotes_gpc() is deprecated in /home3/reasonan/public_html/wp-includes/formatting.php on line 4371
Deprecated: Function get_magic_quotes_gpc() is deprecated in /home3/reasonan/public_html/wp-includes/formatting.php on line 4371
Deprecated: Function get_magic_quotes_gpc() is deprecated in /home3/reasonan/public_html/wp-includes/formatting.php on line 4371
Deprecated: Function get_magic_quotes_gpc() is deprecated in /home3/reasonan/public_html/wp-includes/formatting.php on line 4371
Deprecated: Function get_magic_quotes_gpc() is deprecated in /home3/reasonan/public_html/wp-includes/formatting.php on line 4371
Deprecated: Function get_magic_quotes_gpc() is deprecated in /home3/reasonan/public_html/wp-includes/formatting.php on line 4371
After struggling a bit earlier in the week, it was nice to end with a positive experience in Precalculus on Friday. There’s nothing profound in the sentences below, but I still think it’s worth writing down, if for no other reason than increasing the likelihood that I recall some of this as I plan future lessons. Context (for the Year) We made the move to block schedule this ... ]]>
Deprecated: Function get_magic_quotes_gpc() is deprecated in /home3/reasonan/public_html/wp-includes/formatting.php on line 4371
Deprecated: Function get_magic_quotes_gpc() is deprecated in /home3/reasonan/public_html/wp-includes/formatting.php on line 4371
Warning: count(): Parameter must be an array or an object that implements Countable in /home3/reasonan/public_html/wp-includes/media.php on line 1206
Deprecated: Function get_magic_quotes_gpc() is deprecated in /home3/reasonan/public_html/wp-includes/formatting.php on line 4371
Deprecated: Function get_magic_quotes_gpc() is deprecated in /home3/reasonan/public_html/wp-includes/formatting.php on line 4371
Warning: count(): Parameter must be an array or an object that implements Countable in /home3/reasonan/public_html/wp-includes/media.php on line 1206
Deprecated: Function get_magic_quotes_gpc() is deprecated in /home3/reasonan/public_html/wp-includes/formatting.php on line 2432
Deprecated: Function get_magic_quotes_gpc() is deprecated in /home3/reasonan/public_html/wp-includes/formatting.php on line 4371
Deprecated: Function get_magic_quotes_gpc() is deprecated in /home3/reasonan/public_html/wp-includes/formatting.php on line 4371
Deprecated: Function get_magic_quotes_gpc() is deprecated in /home3/reasonan/public_html/wp-includes/formatting.php on line 4371
Deprecated: Function get_magic_quotes_gpc() is deprecated in /home3/reasonan/public_html/wp-includes/formatting.php on line 4371
Deprecated: Function get_magic_quotes_gpc() is deprecated in /home3/reasonan/public_html/wp-includes/formatting.php on line 4371
Deprecated: Function get_magic_quotes_gpc() is deprecated in /home3/reasonan/public_html/wp-includes/formatting.php on line 4371
Deprecated: Function get_magic_quotes_gpc() is deprecated in /home3/reasonan/public_html/wp-includes/formatting.php on line 4371
Deprecated: Function get_magic_quotes_gpc() is deprecated in /home3/reasonan/public_html/wp-includes/formatting.php on line 4371
Deprecated: Function get_magic_quotes_gpc() is deprecated in /home3/reasonan/public_html/wp-includes/formatting.php on line 4371
Deprecated: Function get_magic_quotes_gpc() is deprecated in /home3/reasonan/public_html/wp-includes/formatting.php on line 4371
Deprecated: Function get_magic_quotes_gpc() is deprecated in /home3/reasonan/public_html/wp-includes/formatting.php on line 4371
Deprecated: Function get_magic_quotes_gpc() is deprecated in /home3/reasonan/public_html/wp-includes/formatting.php on line 4371
Deprecated: Function get_magic_quotes_gpc() is deprecated in /home3/reasonan/public_html/wp-includes/formatting.php on line 4371
Deprecated: Function get_magic_quotes_gpc() is deprecated in /home3/reasonan/public_html/wp-includes/formatting.php on line 4371
Deprecated: Function get_magic_quotes_gpc() is deprecated in /home3/reasonan/public_html/wp-includes/formatting.php on line 4371
Deprecated: Function get_magic_quotes_gpc() is deprecated in /home3/reasonan/public_html/wp-includes/formatting.php on line 4371
Context (for the Year)
We made the move to block schedule this year. After years of being opposed to the idea, I recently softened my stance and even began to think a block schedule approach might be helpful. I’m still learning the ropes, but the “early returns” in my own classroom (from me as well as my students) are positive.
Context (for the week)
We’ve been working on trigonometric properties and identities. I had a rather disappointing experience in Precalculus on Wednesday, and though I can’t recall the details of last Monday, I’m pretty sure it was far from amazing.
The Daily Plan
As students shuffle into class each day, I throw “The Daily Plan” on the projector. Friday’s looked like this:

Mini Exploration
Some of what I disliked about my lessons from earlier in the week related to the all-eyes-on-me approach I took. So I decided to start Friday with a miniature exploration. Again, nothing profound, but something that would:
- Provide students with a brief review of the properties they would need to have at-the-ready for today
- Give each group (or pair) of students an opportunity to proceed as quickly/slowly as they needed to
- Challenge students to express their thinking in writing and in discussion
- Allow me to wander through the room, checking progress, lingering with students who needed extra support (which I tried to supply via questions, not statements)
- Require students to do some individual and small group thinking and wrestling before our whole class discussion/recap
Here’s what the handout looked like:


And here’s a link to the two-page PDF (in all of its non-glory).
Reordering Task
After debriefing the mini exploration (which included a whole-class conversation and a “puppet volunteers” work-through of Problem 6), we moved on to a reordering task. It’s an idea I had been thinking about for a few months (years?), but one I had never put into action. After using this on Friday, I think I’m sold on its quality—at least for some problem types.
Here’s a look at the student page:

And a link to the handout, for closer inspection.
Properties Quiz
I should have done this each day for the last three days, but my moments of genius are few and far between. On several occasions in class we’ve described the properties as “puzzle pieces” and proving identities as “solving a puzzle.” If you don’t have the basic properties memorized, it’s like trying to do a puzzle with pieces missing. Apparently that metaphor was insufficiently inspiring, as many of my students spent little to no additional time at home committing the reciprocal, quotient, and Pythagorean properties to memory. And this lack of recall presents a problem for the work at hand.
An older version of me would have tried to remedy that problem by lecturing the class about the importance of blah blah blah. On Friday, I decided to skip over that part and instead gave students a few minutes of class time to work on committing these bad boys to memory. “5/5/5” on the daily agenda meant five minutes of silent and individual study, five minutes of partners quizzing one another verbally and/or in writing, and five minutes of do-the-best-you-can-on-your-own quizzing. I may have only given them 3 or 4 minutes for each stage, but the results were great. Most students now have the “puzzle pieces” in hand, and those that do not know exactly where their weaknesses lie.
Visual Patterns
In a block schedule setting, I’m finding that focusing on trig properties and identities for the entire class period is just too much of the same thing. To mix things up—and to plant some seeds for an upcoming functions- and graphing-heavy chapter—we worked through a Visual Pattern (our first one in months). As an aside, I wish I did a better job of sticking with my start-of-the-year resolutions (e.g., “Visual Patterns will be a regular feature in such-and-such class this year.”) I suppose it’s not too late to bring it back into the mix…
Personal Takeaway
If my second sentence in this post is going to be true, I need to nail down why I think Friday was better than the other days in Precalculus last week. I think it boils down to two things:
- In designing the lesson, I endeavored to make my students the key do-ers throughout the lesson (whether via thinking, writing, arguing, sorting, explaining, or defending)
- In an effort to maintain student focus and fight off the feeling of the class “dragging on and on,” I provided students with several distinct (though still related) tasks
As I create my next set of daily plans, I’ll try to keep these little victories from Friday in mind.
]]>Deprecated: Function get_magic_quotes_gpc() is deprecated in /home3/reasonan/public_html/wp-includes/formatting.php on line 4371
Warning: count(): Parameter must be an array or an object that implements Countable in /home3/reasonan/public_html/wp-includes/media.php on line 1206
Deprecated: Function get_magic_quotes_gpc() is deprecated in /home3/reasonan/public_html/wp-includes/formatting.php on line 2432
Deprecated: Function get_magic_quotes_gpc() is deprecated in /home3/reasonan/public_html/wp-includes/formatting.php on line 4371
Deprecated: Function get_magic_quotes_gpc() is deprecated in /home3/reasonan/public_html/wp-includes/formatting.php on line 4371
Deprecated: Function get_magic_quotes_gpc() is deprecated in /home3/reasonan/public_html/wp-includes/formatting.php on line 4371
Deprecated: Function get_magic_quotes_gpc() is deprecated in /home3/reasonan/public_html/wp-includes/formatting.php on line 4371
Period 2 Well that wasn’t any good. Here’s a picture of the main part of my Calculus lesson from today: One example. That’s it. The central element of my entire lesson was… one example. And not even a task. Just an example. A watch-me-as-I-carefully-walk-through-every-step-of-this-sucker and make-sure-you’re-on-guard-in-case-I-ask-you-any-leading-questions example. Oh my. Granted, there was more after that example, just not a great deal more. And ... ]]>
Deprecated: Function get_magic_quotes_gpc() is deprecated in /home3/reasonan/public_html/wp-includes/formatting.php on line 4371
Deprecated: Function get_magic_quotes_gpc() is deprecated in /home3/reasonan/public_html/wp-includes/formatting.php on line 4371
Warning: count(): Parameter must be an array or an object that implements Countable in /home3/reasonan/public_html/wp-includes/media.php on line 1206
Deprecated: Function get_magic_quotes_gpc() is deprecated in /home3/reasonan/public_html/wp-includes/formatting.php on line 2432
Deprecated: Function get_magic_quotes_gpc() is deprecated in /home3/reasonan/public_html/wp-includes/formatting.php on line 4371
Deprecated: Function get_magic_quotes_gpc() is deprecated in /home3/reasonan/public_html/wp-includes/formatting.php on line 4371
Deprecated: Function get_magic_quotes_gpc() is deprecated in /home3/reasonan/public_html/wp-includes/formatting.php on line 4371
Deprecated: Function get_magic_quotes_gpc() is deprecated in /home3/reasonan/public_html/wp-includes/formatting.php on line 4371
Well that wasn’t any good.
Here’s a picture of the main part of my Calculus lesson from today:

One example. That’s it. The central element of my entire lesson was… one example. And not even a task. Just an example. A watch-me-as-I-carefully-walk-through-every-step-of-this-sucker and make-sure-you’re-on-guard-in-case-I-ask-you-any-leading-questions example. Oh my.
Granted, there was more after that example, just not a great deal more. And none of it great. We actually wrapped up the example, started the “next thing,” and quickly abandoned ship after some “Show me on your fingers how you’re doing” feedback from students revealed that all was not well (not by a long shot).
This changing of gears led to a somewhat-useful last 10 minutes of class (thanks in part to Desmos), which in turn led me to wonder: What did the end of class have that the start of class was missing? For one thing, after seeing the first part flop I had to clarify in my mind the bottom line goal for the lesson. I settled on this: If students left my room with the ability to translate verbal and algebraic problem descriptions into graphs, and those graphs into integral expressions, we’d be golden.
Period 3
Well that wasn’t any good, either.
I went overboard Sunday evening creating a slide deck that (I thought) would help me lead students through a carefully crafted conversation on the topic of trigonometric properties and identities. The slide deck was slick as all get out. But the lesson was boring. You could see it on their little compliant faces. They didn’t even complain. They just sat there. Copying a property or two here, sketching a graph or two there, dutifully jotting down an observation or two when I asked, and so on, for the better part of half an hour. Argh!
Inspiration ≠ Incorporation
At this point I have no idea if I’ve painted a clear picture of what took place today in my classroom. Even less so what’s going on in my head right now. If you’re feeling uncomfortable, abandon ship now, ’cause this is about to get even less coherent.
You see, I’ve been struggling with a number of thoughts over the past few months. To name a few:
- Sam Shah is awesome. As some teachers call out worksheets on Twitter, Sam is busy packing one aha-moment after another into carefully crafted mathematical adventures for his students, all on that oldie-but-goodie 8.5 by 11 format. I want to bring these kinds of things into my own classroom!
- Dan Meyer is awesome. As some teachers give the all-call for real world applications over all else, Dan is blasting through pseudocontext and drawing attention to the heart of the matter (engagement), regardless of whether a task is labeled “real world” or “fake world.” I want to make genuine student engagement a central (and regular) feature of my teaching practice!
- Karim Ani and Team Mathalicious are awesome. As some teachers are firing up Khan Academy accounts and printing off hundred-of-the-same worksheets from Google search results, Karim and the crew are laying siege to the notion that math is uninteresting, unengaging, unimportant, or unworthy of our attention. I want to bring Mathalicious-style conversations into my own lessons!
- Jonathan Claydon is awesome. Seriously, have you seen the pictures of his class over at Infinite Sums? His students do stuff. All the time. They’re active, they’re involved. I don’t care what the lesson is, they’re at the heart of it. I want this to be true of my own students!
And I haven’t even mentioned Stadel, Nguyen, Kaplinsky, Vaudrey, Stevens… The list goes on. And while my inspiration grows, my frustration does too, because I can’t find a way to incorporate all of this awesome into a coherent whole in my own teaching world.
That’s really the issue. And I’m just using a frustrating Monday morning to process what I’ve been struggling with for months in the hope that I can make some sense of it all.
The Challenge
(Still with me? Awesome. Hang in there, we’re almost done.)
So let me try to name my struggle, clearly and succinctly, so I can go about the task of moving beyond it. Here goes:
For the past 500 days I’ve been inspired daily (literally, every single day) by what I see in the MTBoS. At the same time, I have yet to find a way to weave that inspiration into my own practice in a coherent, compatible way.
The Way Forward
I don’t know the entire solution, but I know it starts with this: I’m done designing scripted lessons, those awful handouts with eleven-teen examples that we’ll walk through. Together. All of us. At the same pace. (I’ve created enough of those to last a lifetime, and they don’t develop in students any of what I’m after.) I’m done drawing up anything where I can predict with 99%+ accuracy what the students will be thinking at any given point. I’m done throwing together slide decks that demand students focus on the same thing at the same time. I’m done throttling their insights, their noticings, and their wonderings by squeezing out of them a certain style of efficiency that is anything but effective.
Instead, I’ll be spending my time infusing worksheets with aha-moments and did-you-just-see-that mathematical surprises. I’ll be on the lookout for visuals that mess with students minds and spark dozens of questions they actually want to answer. And I’ll expand my teaching skillset so that I can navigate the waters of a class full of students exploring different problems inspired by the same visual. I’ll take risks, push the boundaries of what I’m currently capable of, and through it all develop my ability to orchestrate rich mathematical discussions, whether they’re centered around a thought-journey disguised as a worksheet, a rich and who-cares-if-it-has-no-context problem, an engaging and demanding task, or an honest-to-goodness real-world scenario. And whatever I do, I’ll make sure my students are at the center of it.
In short, I’m done with trying to script their thinking. I’m going all in with prompting them to think. “The script is dead. Long live the prompt!”
]]>
Deprecated: Function get_magic_quotes_gpc() is deprecated in /home3/reasonan/public_html/wp-includes/formatting.php on line 4371
Deprecated: Function get_magic_quotes_gpc() is deprecated in /home3/reasonan/public_html/wp-includes/formatting.php on line 4371
Warning: count(): Parameter must be an array or an object that implements Countable in /home3/reasonan/public_html/wp-includes/media.php on line 1206
Deprecated: Function get_magic_quotes_gpc() is deprecated in /home3/reasonan/public_html/wp-includes/formatting.php on line 2432
Deprecated: Function get_magic_quotes_gpc() is deprecated in /home3/reasonan/public_html/wp-includes/formatting.php on line 4371
Deprecated: Function get_magic_quotes_gpc() is deprecated in /home3/reasonan/public_html/wp-includes/formatting.php on line 4371
Deprecated: Function get_magic_quotes_gpc() is deprecated in /home3/reasonan/public_html/wp-includes/formatting.php on line 4371
Deprecated: Function get_magic_quotes_gpc() is deprecated in /home3/reasonan/public_html/wp-includes/formatting.php on line 4371
Friday I had a sub Friday in Precalculus. My students were set to take a group of mini-assessments for Chapter 3. I expected they would have some additional time at the end of class, so (out of love for the substitute, and a desire not to waste class time) I wanted to launch Chapter 4 with an exploratory activity. I think it has ... ]]>
Deprecated: Function get_magic_quotes_gpc() is deprecated in /home3/reasonan/public_html/wp-includes/formatting.php on line 4371
Deprecated: Function get_magic_quotes_gpc() is deprecated in /home3/reasonan/public_html/wp-includes/formatting.php on line 4371
Deprecated: Function get_magic_quotes_gpc() is deprecated in /home3/reasonan/public_html/wp-includes/formatting.php on line 4371
Warning: count(): Parameter must be an array or an object that implements Countable in /home3/reasonan/public_html/wp-includes/media.php on line 1206
Deprecated: Function get_magic_quotes_gpc() is deprecated in /home3/reasonan/public_html/wp-includes/formatting.php on line 2432
Deprecated: Function get_magic_quotes_gpc() is deprecated in /home3/reasonan/public_html/wp-includes/formatting.php on line 4371
Deprecated: Function get_magic_quotes_gpc() is deprecated in /home3/reasonan/public_html/wp-includes/formatting.php on line 4371
Deprecated: Function get_magic_quotes_gpc() is deprecated in /home3/reasonan/public_html/wp-includes/formatting.php on line 4371
Deprecated: Function get_magic_quotes_gpc() is deprecated in /home3/reasonan/public_html/wp-includes/formatting.php on line 4371
I had a sub Friday in Precalculus. My students were set to take a group of mini-assessments for Chapter 3. I expected they would have some additional time at the end of class, so (out of love for the substitute, and a desire not to waste class time) I wanted to launch Chapter 4 with an exploratory activity. I think it has some potential for improvement, but this is what I scraped together while getting my sub plans ready.
Monday
Today my goal was to move toward proving trigonometric identities (see below for a handout), but first I wanted to debrief from their experience on Friday. I gave students three minutes to share their observations and questions in their groups, then I asked each group to share one noticing and one wondering. We ended up with this:

Onward
My favorite part of all of this? Built on their questions, we’re now headed into Chapter 4 with a bit more motivation than we might have otherwise had. Also, there were a few wonderings that surprised me (at least in subtle ways), and these will almost certainly enrich our conversations over the coming days.
P.S. Up next, this.
P.P.S. That last handout is far from my best work, but it helped us transition from the noticing and wondering into some basic proofs.
]]>Deprecated: Function get_magic_quotes_gpc() is deprecated in /home3/reasonan/public_html/wp-includes/formatting.php on line 4371
Deprecated: Function get_magic_quotes_gpc() is deprecated in /home3/reasonan/public_html/wp-includes/formatting.php on line 4371
Warning: count(): Parameter must be an array or an object that implements Countable in /home3/reasonan/public_html/wp-includes/media.php on line 1206
Deprecated: Function get_magic_quotes_gpc() is deprecated in /home3/reasonan/public_html/wp-includes/formatting.php on line 4371
Deprecated: Function get_magic_quotes_gpc() is deprecated in /home3/reasonan/public_html/wp-includes/formatting.php on line 4371
Deprecated: Function get_magic_quotes_gpc() is deprecated in /home3/reasonan/public_html/wp-includes/formatting.php on line 4371
Warning: count(): Parameter must be an array or an object that implements Countable in /home3/reasonan/public_html/wp-includes/media.php on line 1206
Deprecated: Function get_magic_quotes_gpc() is deprecated in /home3/reasonan/public_html/wp-includes/formatting.php on line 2432
Deprecated: Function get_magic_quotes_gpc() is deprecated in /home3/reasonan/public_html/wp-includes/formatting.php on line 4371
Deprecated: Function get_magic_quotes_gpc() is deprecated in /home3/reasonan/public_html/wp-includes/formatting.php on line 4371
Deprecated: Function get_magic_quotes_gpc() is deprecated in /home3/reasonan/public_html/wp-includes/formatting.php on line 4371
Deprecated: Function get_magic_quotes_gpc() is deprecated in /home3/reasonan/public_html/wp-includes/formatting.php on line 4371
Deprecated: Function get_magic_quotes_gpc() is deprecated in /home3/reasonan/public_html/wp-includes/formatting.php on line 4371
Deprecated: Function get_magic_quotes_gpc() is deprecated in /home3/reasonan/public_html/wp-includes/formatting.php on line 4371
Deprecated: Function get_magic_quotes_gpc() is deprecated in /home3/reasonan/public_html/wp-includes/formatting.php on line 4371
Deprecated: Function get_magic_quotes_gpc() is deprecated in /home3/reasonan/public_html/wp-includes/formatting.php on line 4371
Deprecated: Function get_magic_quotes_gpc() is deprecated in /home3/reasonan/public_html/wp-includes/formatting.php on line 4371
Deprecated: Function get_magic_quotes_gpc() is deprecated in /home3/reasonan/public_html/wp-includes/formatting.php on line 4371
Deprecated: Function get_magic_quotes_gpc() is deprecated in /home3/reasonan/public_html/wp-includes/formatting.php on line 4371
Deprecated: Function get_magic_quotes_gpc() is deprecated in /home3/reasonan/public_html/wp-includes/formatting.php on line 4371
I created a silly little game for my Algebra 1 students several weeks ago. The motivation? Five-fold! We’re a little weak with graphing lines. Some open-ended, Desmos-driven, instant-feedback style practice may help. Domain and range? Yeah, not so much. Inequalities? Haven’t done them justice. Yet. (Growth mindset, baby!) Vertex form for quadratics? Still struggling. We tried Des-man a few days before this game ... ]]>
Deprecated: Function get_magic_quotes_gpc() is deprecated in /home3/reasonan/public_html/wp-includes/formatting.php on line 4371
Deprecated: Function get_magic_quotes_gpc() is deprecated in /home3/reasonan/public_html/wp-includes/formatting.php on line 4371
Deprecated: Function get_magic_quotes_gpc() is deprecated in /home3/reasonan/public_html/wp-includes/formatting.php on line 4371
Warning: count(): Parameter must be an array or an object that implements Countable in /home3/reasonan/public_html/wp-includes/media.php on line 1206
Deprecated: Function get_magic_quotes_gpc() is deprecated in /home3/reasonan/public_html/wp-includes/formatting.php on line 4371
Deprecated: Function get_magic_quotes_gpc() is deprecated in /home3/reasonan/public_html/wp-includes/formatting.php on line 4371
Deprecated: Function get_magic_quotes_gpc() is deprecated in /home3/reasonan/public_html/wp-includes/formatting.php on line 4371
Warning: count(): Parameter must be an array or an object that implements Countable in /home3/reasonan/public_html/wp-includes/media.php on line 1206
Deprecated: Function get_magic_quotes_gpc() is deprecated in /home3/reasonan/public_html/wp-includes/formatting.php on line 2432
Deprecated: Function get_magic_quotes_gpc() is deprecated in /home3/reasonan/public_html/wp-includes/formatting.php on line 4371
Deprecated: Function get_magic_quotes_gpc() is deprecated in /home3/reasonan/public_html/wp-includes/formatting.php on line 4371
Deprecated: Function get_magic_quotes_gpc() is deprecated in /home3/reasonan/public_html/wp-includes/formatting.php on line 4371
Deprecated: Function get_magic_quotes_gpc() is deprecated in /home3/reasonan/public_html/wp-includes/formatting.php on line 4371
Deprecated: Function get_magic_quotes_gpc() is deprecated in /home3/reasonan/public_html/wp-includes/formatting.php on line 4371
Deprecated: Function get_magic_quotes_gpc() is deprecated in /home3/reasonan/public_html/wp-includes/formatting.php on line 4371
Deprecated: Function get_magic_quotes_gpc() is deprecated in /home3/reasonan/public_html/wp-includes/formatting.php on line 4371
Deprecated: Function get_magic_quotes_gpc() is deprecated in /home3/reasonan/public_html/wp-includes/formatting.php on line 4371
Deprecated: Function get_magic_quotes_gpc() is deprecated in /home3/reasonan/public_html/wp-includes/formatting.php on line 4371
Deprecated: Function get_magic_quotes_gpc() is deprecated in /home3/reasonan/public_html/wp-includes/formatting.php on line 4371
Deprecated: Function get_magic_quotes_gpc() is deprecated in /home3/reasonan/public_html/wp-includes/formatting.php on line 4371
Deprecated: Function get_magic_quotes_gpc() is deprecated in /home3/reasonan/public_html/wp-includes/formatting.php on line 4371
- We’re a little weak with graphing lines. Some open-ended, Desmos-driven, instant-feedback style practice may help.
- Domain and range? Yeah, not so much.
- Inequalities? Haven’t done them justice. Yet. (Growth mindset, baby!)
- Vertex form for quadratics? Still struggling.
- We tried Des-man a few days before this game and found nothing but pain and frustration. Some could be attributed to me (in particular, a bungled launch of the activity), some to students’ lingering struggles (noted above), and most of the rest to the declining state of our netbook cart. (But they seemed so cool in 2009!)
At any rate, to get that bad taste out of my mouth and set the stage for greater success on the next Des-man go around, I created the Dot Capture Game. Here’s what you need:
- Students (working in pairs)
- Devices (we actually used 50% smartphones, 25% tablets, 25% laptops)
- The world’s greatest, most beautiful graphing calculator
And of course, the handout:

Getting Started
Give a brief intro—or none at all—and turn ’em loose. If your experience is anything like mine, you’ll find yourself the weaving in and out of some great (albeit trivially-inspired) conversations about slope, intercepts, point-slope form, domain, range, inequalities and shading, vertices, direction of opening, etc.
This is definitely not high-quality modeling stuff (it’s not even low-quality modeling stuff), but it proved a great way to engage students with meaningful (read: productive) practice on a variety of topics related to graphing.
Oh, and the winner in my class? Here you go:

Final Thoughts
After trying this out in Algebra 1, I thought I’d throw it at my Algebra 2 and Precalculus students to see what they would do with it. It turned out to be good practice in those settings as well. Before sharing with these followup classes, a quick tweak to the handout was in order. In my first class, several students lost their graphs and expressions after hitting a deadly combination of keys on their device, and only one or two had been keeping a shiny written record. So to protect against future heartache, I added a second page to the handout. Here’s what one of them looked like at the end of class:

Update
Here’s a sweet suggestion from Desmos:
]]>@mjfenton What if Ss rolled two dice to determine which curves they had to use and the numbers also represented the coordinate to capture?
— Desmos.com (@Desmos) May 22, 2014